Every five years, the U.S. Department of Agriculture’s National Agricultural Statistical Service (NASS) conducts a census of farming, working to document the facts about every farm in the country, down to the state and county level. The results of the Agricultural Census provide the most complete picture we have of the directions agriculture is moving and the trends that are emerging.
The most recent Agricultural Census was taken in 2012, with the results released earlier this year. Not surprisingly, the results are massive. For Massachusetts alone, the published findings are 421 pages long, pages filled with tables of data that can quickly slow down even the most motivated reader. (If you’d like to take a look at the complete results, you can download a PDF file here.)
Now there’s an alternative way to sample the results. With the help of our colleagues in UMass Amherst’s Department of Resource Economics, we’ve posted our own tables, charts and some interpretation of the results on our website. You can access them at “Massachusetts Agricultural Data.”
Average size of a farm in Massachusetts? (67 acres.)
Number of women farmers in Massachusetts up or down in between 2007 and 2012? (Up.)
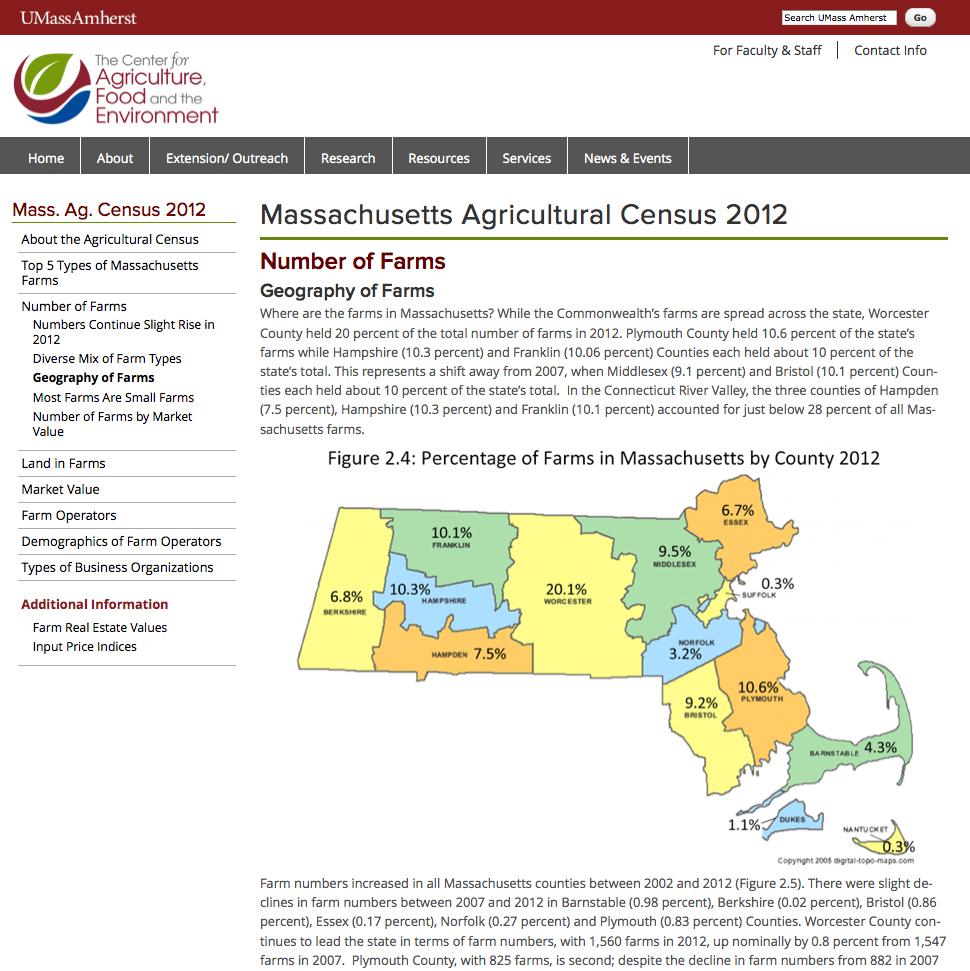
County with the most farms? (Worcester, by far.)
Crop that grows on the most acres in Massachusetts? (Hay.)
Check out the current Census for more facts about farming in the Commonwealth today. However, another interesting way to look at this information is to put it in historical context. USDA’s NASS maintains an online collection of historical Census of Agriculture, back to 1840. While we are happy to report that both the number of farms and the total acreage in farming has increased in each of the last two Censuses (to 7,755 farms on 523,517 acres in 2012 in Massachusetts), it is interesting to compare these numbers to those from back in 1935, when the state had 35,094 farms on 2,195,714 acres.
Last Spring, when we asked for help from Daniel Lass, Department Head in Resource Economics, in developing this material (as his department had for earlier Censuses) he could not have been more helpful. Over the course of the summer, Resource Economics undergrads Nathanael Dunnican and Sean Cullen developed the graphs and tables. Lass and doctoral student Jill Fitzsimmons wrote the interpretive narratives to accompany them
