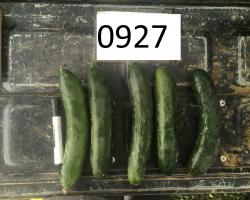
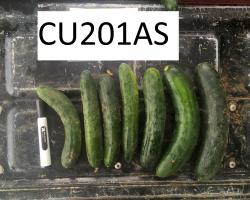
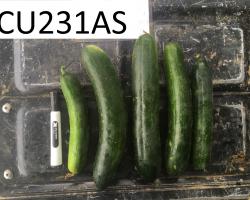
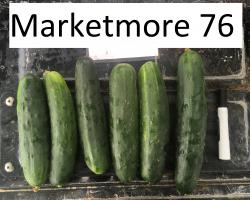
The experiment was conducted at the University of Massachusetts Research and Education Farm in Deerfield, MA in a field with soil classified as a Hadley silt loam. Cucumber seeds were sown 28 May in the greenhouse in 50-cell flats. Soil was amended with 50 lb N/A of Allganic organic fertilizer (15-0-2) and 100 lb K/A of potassium sulfate (0-0-50) and raised beds were formed and covered with 1-mil white-on-black plastic mulch with one drip irrigation line were formed on 18 Jun. Seedlings were planted by hand into the beds on the same day into plots consisting of 10 ft. of row with 6 plants at 18-in. spacing and 10 ft. unplanted buffers between plots within a row. Plots were arranged in a randomized complete block design, with rows on 10-ft. centers. During the season, water was provided as needed via drip irrigation. Weeds were controlled between mulched rows by hand or by mechanical cultivation. Cucumber beetles were managed with Warrior II with Zeon Technology (1.28 fl oz/A) applied on 1 Jul. Aphids were managed with Azatin O (16 oz/A) and MPede (0.12% solution) applied on 26 Jul. Squash bugs were managed with Pyganic EC 5.0 II (1/2 fl oz/gal) and Azatin O (16 fl oz/100 gal) applied on 26 Aug. Plants were fertilized through the drip lines using 13 lb N/A of calcium nitrate (YaraLiva 15.5-0-0) on 16 and 30 Jul. Downy mildew (DM) and powdery mildew (PM) severity was assessed by estimating percentage of symptomatic leaf area in each plot, as well as on ten randomly selected leaves per plot. Ratings were made on 19 and 26 Jul; 2, 9, 16, 23, and 30 Aug; and 6, 13, and 20 Sep. Disease severity data were used to calculate area under the disease progress curve (AUDPC). Marketable sized fruit (>6 in.) were harvested from the plants twice weekly from 19 Jul through 20 Sep and total and marketable yields were recorded. Fruit was considered unmarketable if it was misshapen, had excessive bird or insect damage, or was symptomatic for anthracnose, caused by Colletotrichum orbiculare, or Alternaria leaf spot, caused by Alternaria cucumerina, which were also present in the field. Average monthly temperatures (°F) were 73.9 in Jul, 69.1 in Aug, and 61.0 in Sep. Rainfall (in.) was 2.89, 2.44, and 1.00 for these months, respectively. All data were analyzed by general linear model and means were compared using Fisher’s least significant difference test (P = 0.05).
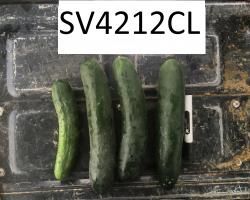
Natural inoculum of PM and DM was the only source of inoculum for this experiment. PM was first observed on 2 Aug on ‘Itachi’, and DM was first observed on 23 Aug on ‘Marketmore 76’; both varieties continued to have high levels of PM and DM, respectively, throughout the season. All varieties had lower DM and PM severity and therefore had significantly lower AUDPC values than ‘Marketmore 76’. ‘CU231AS’ had the lowest DM AUDPC, but produced one of the lowest marketable yields of all of the varieties. ‘SV4142CL’ had the lowest PM AUDPC. Although ‘Marketmore 76’ displayed the highest levels of PM and DM, it produced a relatively high marketable yield. ‘SV4142CL’ produced the highest marketable yield of all of the varieties, with ‘Marketmore 76’, ‘SV4212CL’, and ‘CU201AS’ producing slightly but not significantly lower marketable yields. ‘CU201AS’ performed consistently well in regard to disease resistance and marketable yield. ‘0927’, ‘SV4142CL’, and SV4212CL’ also performed well across all three parameters but had slightly reduced resistance to DM (‘SV4142CL’), PM (‘0927’), or both (‘SV4212CL’).
| Table 1. Yield and area under the disease progress curve for dm and pm | ||||||||
|---|---|---|---|---|---|---|---|---|
| Total weight (lbs)y | Marketable weight (lbs)y | DM AUDPCz | PM AUDPCz | |||||
| Marketmore 76 | 206.6 | bc | 162.9 | bc | 1032 | c | 682.5 | c |
| SV4142CL | 235.8 | c | 178.9 | c | 415.6 | b | 148.8 | a |
| Bristol | 163.8 | a | 119.1 | a | 358.8 | b | 551.3 | abc |
| CU231AS | 190.9 | ab | 123.6 | a | 91.9 | a |
262.5 |
ab |
| Itachi | 171.4 | ab | 136.7 | ab | 1010.6 | c | 3106 | d |
| SV4142CL | 207.2 | bc | 156.2 | abc | 354.4 | b | 607.3 | bc |
| CU201AS | 197.8 | abc | 157.3 | abc |
297.5 |
ab | 529.4 | abc |
| 0927 | 175.1 | ab | 130.6 | ab | 245.0 | ab | 573.1 | bc |
| p-value | 0.0335 | 0.0394 | <0.0001 | <0.0001 | ||||
|
xData were analyzed using PROC GLM and means were separated using Fisher’s LSD. Numbers within each column followed by the same letter are not significantly different from each other. yTotal and marketable yields from each plot were recorded twice weekly and are here summed across the whole season. zArea under the disease progress curve was calculated using the formula : ∑n i=1[(Ri+1 + Ri)/2] [ti+1 – ti], where R = disease severity rating (% of leaf surface affected) at the ith observation, ti = time (days) since the previous rating at the ith observation, and n = total number of observations). Values were calculated based on the average percent disease severity across the plot. |
||||||||
This research was funded by Johnny’s Selected Seeds and the New England Vegetable & Berry Growers’ Association.
