 The experiment was conducted at the University of Massachusetts Research and Education Farm in Deerfield, MA in a field with soil classified as a Hadley silt loam. Cucumber seeds were sown 15 Jun in the greenhouse in 50-cell flats and moved outside to harden off on 5 Jul. Soil was amended with 130, 106, and 80 lb/A of N, P, and K, respectively, in the form of Kreher’s pelleted chicken manure (5-4-3) prior to bed formation. Raised beds were formed and covered with 1-mil white-on-black plastic mulch with one drip irrigation line. Seedlings were planted by hand into the beds on 7 Jul, with plots consisting of 10 ft of bed with 6 plants in a single row at 18-in. spacing and 10-ft unplanted buffers between plots within a bed. Plots were arranged in a randomized complete block design, with beds on 15-ft centers. Seedlings were irrigated once at transplant, and subsequent irrigation was not needed
  due to wet conditions all season. Weeds were controlled between mulched beds by hand and by mechanical cultivation. Downy mildew (DM) severity was assessed by estimating the percentage of symptomatic leaf area in each plot, as well as on ten randomly selected leaves per plot. Ratings were made on 11, 18, and 25 Jul, and 1, 8, 15, 22, and 29 Aug. Disease severity data were used to calculate area under the disease progress curve (AUDPC). Marketable-sized fruit were harvested from the plants twice weekly from 1 Aug to 8 Sep and total and marketable yields were recorded. Fruit was considered unmarketable if it was misshapen or had excessive bird or insect damage.
 Average monthly temperatures (°F) were 74.9 from 7 Jul to 31 Jul and 69.9 in Aug. It was an
exceedingly wet growing season, with 9.28 in rainfall from 7 Jul to 31 Jul and 3.87 in in Aug. All data were analyzed using a general linear model and means were compared using Tukey’s honestly significant difference test (P = 0.05) in SAS (SAS v.9.4, SAS Institute, Cary, NC).
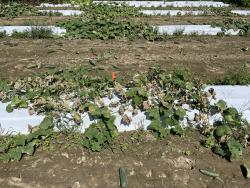
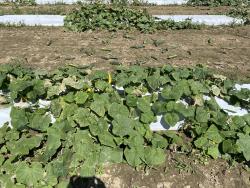
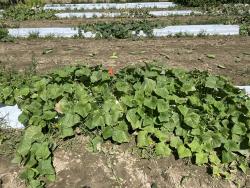
Natural inoculum of DM was the only source of inoculum for this trial. DM arrived in the trial relatively late in the season but developed quickly once it arrived. DM was first observed on 8 Aug on ‘Stronghold’, ‘Gatehouse’, and ‘EWS-CUC-060’, followed by the remaining varieties on 15 Aug. ‘Chaperon’, ‘SVCS0029’, and ‘EWS-CUC-059’ had the lowest AUDPC values, and ‘Chaperon’ and ‘EWS-CUC-059’ also had the highest marketable yields, making them good options for late summer cucumber production when DM pressure is high. ‘EWS-CUC-060’ had the highest AUDPC values. ‘TSX-CU248AS’, ‘TSX-CU247AS’, and ‘TXS-CU249’ had the lowest marketable yields, in part due to striped cucumber beetle feeding damage, which was severe on these varieties.
Cultivar |
DM AUDPCz |
Total Yield (lbs)y |
Marketable Yield (lbs)7 |
|||
|---|---|---|---|---|---|---|
| Chaperon |
393.95 |
a | 51.488 | c | 41.29 | c |
| SVCS0029 | 455 | a | 34.965 | abc | 49.56 | ab |
| EWS-CUC-059 | 533.75 | a | 46.640 | bc | 36.00 | bc |
| TSX-CU247AS | 634.375 | ab | 40.605 | abc | 15.34 | a |
| TSX-CU248AS | 665 | ab | 38.980 | bc | 13.71 | a |
| Gateway | 695.625 | abc | 45.560 | bc | 23.94 | abc |
| TSX-CU249AS | 1185.625 | bcd | 22.687 | a | 14.34 | a |
| Stronghold | 1325.625 | cd | 33.365 | abc | 28.41 | abc |
| Gatehouse | 1330 | cd | 28.798 | ab | 25.15 | abc |
| EWS-CUC-060 | 1386.875 | d | 27.955 | ab | 24.17 | abc |
| p-value | <0.0001 | 0.0027 | 0.0001 | |||
| zArea under the disease progress curve was calculated from 23 Jul to 7 Sep according to the formula: ∑n i=1[(Ri+1 + Ri)/2] [ti+1 – ti], where R = disease severity rating (% of leaf surface affected) at the ith observation, ti = time (days) since the previous rating at the ith observation, and n = total number of observations. Values were calculated based on the average percent disease severity across the plot. yTotal and marketable yields from each plot were recorded twice weekly then summed across the season. Assessments were made on 2, 9, 12, 16, 19, 23, 26, 30 Aug and 2, 7, and 9 Sep. xData were analyzed using PROC GLM and means were separated using Tukey's HSD at alpha level 0.05. Numbers within each column followed by the same letter are not significantly different from each other. |
||||||