Turf Irrigation and Water Conservation Series
The following in-depth fact articles on turf irrigation and water conservation are the result of several years of research at the University of Massachusetts. The overall goal of this research is to reduce the amount of water applied for turf irrigation to the lowest possible level required to sustain the desired level of turf quality and function. The practices outlined are appropriate for a range of irrigated turf environments, from lawns, to sports fields, to golf courses.
Turf Irrigation Series No. 1 Turf Irrigation Series No. 2
Turf Irrigation Series No. 1: Use of Meteorological Data to Estimate Irrigation Requirements of Recreational Turf: Evapotranspiration and Crop Coefficients for the Cool-Humid Region
Recreational Turf vs. Lawn Turf
Recreational turf is under intense stress from athletic activities caused by damage from wear, scuffing, shearing, turf displacement and soil compaction. Numerous factors affect the durability of turf to traffic stresses including the type and time of traffic, turfgrass species and cultivar, soil type, soil water content during use, recovery time, and maintenance practices. Major shortages of water applied as irrigation to turf can have significant and diminishing affects on maintaining safe and durable athletic turf and playable golf greens and tees. Lawn turf may enter into a temporary state of dormancy as a result of water deficits with little impact on long-term survival of turf. Alternatively, trafficked recreational turf under the same water deficits can cause permanent damage to the survival of the turfgrass plant as well as increase potential injuries to athletes including children.
Meeting without exceeding the proper amounts of water applied as irrigation is critical to maintaining safe and durable recreational playing surfaces. Over-irrigation promotes leaching of water and the movement of contaminants into ground water and must be avoided to preserve environmental health and to conserve water. As such, over-watering as irrigation promotes significant waste of water with no benefit to plant health and society.
Recreational turf is not only different from lawn turf because of its higher irrigation requirements for optimal function under traffic, but in addition, trafficked turf has higher requirements for aerial shoot density. Low soil exposure and high turfgrass cover are tantamount to reducing soil compaction tendencies and promoting proper ball bounce, footing and traction, and tolerance to wear stress. High leaf area and low soil exposure are unique properties to turf that make estimating water use more reliable when using meteorological (climatic) data.
Turf Water Use and Evapotranspiration
Quantifying water use in turfgrass is essential for proper irrigation. To that end, using the proper amount of water lost from turf systems as evaporation from the soil plus transpirational water lost from associated leaf surfaces can be effectively measured as evapotranspiration (ET).
Evapotranspiration (ET) = The sum total of water loss as evaporation from the soil surface plus transpirational water loss associated with the leaf surface. In recreational turf systems the majority of ET is water loss as transpiration because of the high leaf area (and soil shading) and density of recreational turf.
The water lost from the soil-root zone through the vegetative system into the bulk atmospheric air as turf ET is the amount of water that should be applied as irrigation and is referred as “ET replacement”. Turf ET replacement allows for recharge of root zones while at the same time diminishes leaching and movement of water below the effective rooting depth during irrigation practices. Actual turf ET is denoted as “ETT” and is accurately measured using weighing-lysimeters. Turf ETT using lysimeters is rarely measured except for experimental purposes. Lysimeter-based turf ETT is labor intensive and is not practical for estimating irrigation requirements.
Turf ETt = Actual evapotranspiration from a turf system measured directly using weighing lysimeters. This is the ideal (standard) amount of water to apply as irrigation to fully recharge turf rootzones and to prevent leaching by over-watering. Lysimeter-based turf ETT is determined experimentally but can be predicted using reference ETo
Turf water use measured using lysimeter-based turf ETT is affected by numerous factors including soil water content, climatic (evaporative demand) factors, and cultural management factors. To sustain active vegetative growth for optimal traffic tolerance soil water is generally maintained at levels sufficient for active growth. Therefore, soil moisture for recreational turf under traffic is generally not growth limiting. Under these conditions where soil water is favorable for growth, meteorological and cultural management factors are important factors affecting turf ETT. Alternatively, under progressively greater soil moisture deficits caused by soil drying resulting in turf dormancy from drought, turf ETT approaches zero and meteorological and turf management factors exhibit less influence on turf ETT.
Turf ETT is the transfer of heat as water vapor (i.e., heat transfer as ETT) from the soil surface and leaf-canopy surfaces into the bulk (atmospheric) air above the turf system. This process is influenced by a number of cultural management practices. One of the most important factors affecting heat transfer as turf ETT is the mowing height of cut (HOC). Furthermore, the frequency of mowing is another important factor in the transfer of heat as turf ETT. Both increasing mowing frequency and lower HOC diminish leaf area and therefore both practices inhibit (lower) turf ETT and heat transfer. Less leaf area in summer under shorter HOC can cause greater warming of turf canopies. In such cases it’s not unusual for shorter HOC golf course turf such as greens and fairways to exhibit significantly higher canopy temperatures in summer caused by lower turf ETT (i.e., less heat transfer) compared to taller lawn grass or golf course rough areas. Similarly, faster leaf growth rates in summer from nitrogen (N) induced leaf growth increases leaf area and promotes greater interception of solar radiation as heat, which increases heat transfer as higher turf ETT (i.e., cooler leaf temperature). Overall, practices in summer such as higher HOC (and decrease mowing frequency) combined with higher N rates will promote greater leaf area and turf ETT, thereby increasing heat transfer into the bulk atmosphere.
Compared to short cut turfgrasses, faster and taller growing turfgrasses not only interact with and intercept greater solar radiation as heat (which increase turf ETT), but the taller canopies interact more effectively with wind (turbulence). Greater turbulence (wind) associated with taller canopies causes’ greater turbulent flow and results in mixing of the Turf ETT = Actual evapotranspiration from a turf system measured directly using weighing lysimeters. This is the ideal (standard) amount of water to apply as irrigation to fully recharge turf rootzones and to prevent leaching by over-watering. Lysimeter-based turf ETT is determined experimentally but can be predicted using reference ETo. more humid canopy air with the drier bulk atmospheric air. Greater turbulent flow transfers more water vapor as turf ETT. As such, meteorological (climatic) factors such as solar radiation, relative humidity (RH), air temperature and wind speed (turbulence) are major meteorological factors affecting ET. Evapotranspiration increases with greater solar radiation (clear sky vs. cloud cover), drier air (lower RH), higher air temperatures, and greater turbulence as wind speed increases. For example, climatic factors measured in summer (June through September) at the Troll Turf Research & Education Center in South Deerfield MA follow closely with these meteorological factors with 74%, 53%, and 21% of turf ET accounted for by solar radiation, relative humidity, and air temperature, respectively.
Meteorological Data and Reference Evapotranspiration (ETo)
As an alternative to direct measurement of actual turf ETT using lysimeters, daily meteorological measurements (solar radiation, air temperature, wind speed, and relative humidity) collected by nearby weather stations can be used to predict ET. These predictions are also referred to as “Reference ET” and are denoted as “ETo”. As predictions, reference ETo is not necessarily directly comparable to actual turf ETT derived using weighing-lysimeters. First, mathematical models are used to calculate and convert meteorological data to ETo as inches of water lost per day. Second, numerous reference ETo models exist that have different mathematical solutions and predictions for reference ETo. However, the reference ETo model accepted as the single equation for crop irrigation as recommended by the scientific community in their report (paper 56) to the Food and Agriculture Organization of the United Nations, is the Penman-Monteith (PM) reference ETo equation (Allen et al., 1998); designated as FAO-56 PM ETo. Third, meteorological data does not adjust for cultural factors such as mowing frequency, HOC, N fertilization as well as other factors such as species and cultivars or conditions such as thatch and soil compaction, which can alter actual turf ETT as the amount of water to be applied as irrigation.
Reference ETo = Prediction of turf ETT derived using daily meteorological measurements collected from nearby weather stations. Reference ETo is calculated using a reliable reference equation such as FAO 56 Penman-Monteith (PM). Reference ETo must be adjusted (corrected) to match turf ETT using crop coefficients.
To transfer meteorologically derived reference ETo values from nearby weather stations to match actual turf water use as turf ETT, transfer factors or multipliers must be derived. These multipliers or coefficients are computed and tested experimentally and are called “crop coefficients” and are denoted as “Kc” values.
Crop Coefficients (Kc) for Transferring Reference ETo to Turf ETT
Crop coefficients are simple mathematical ratios calculated as:
Kc = ETT / ETo [Eq. 1]
where ETT is actual water lost from the turf as ET measured using weighing-lysimeters and ETo is the reference ET computed using some meteorological equation such as FAO-56 PM ETo procedures from a nearby weather station. Meteorological reference equations such as FAO-56 PM ETo assume the turf is tall grass (3 to 6 inch HOC) that is not short of water and therefore the turf is actively growing turfgrass providing 100% grass cover and soil shading.
Crop coefficient (Kc) = A unitless, mathematical multiplier used to adjust reference ETo (inch/day) to match actual turf ETT (inch/day). Crop coefficients are determined experimentally through research and are used to derived turf ETT by calculation as: turf ETT = Kc x ETo. The appropriate crop coefficient must be selected to match (account for) the variations in turf ETT caused by factors such as mowing, fertilization as well as other cultural practices.
Crop coefficients (i.e., Kc values calculated as Eq. 1) are determined experimentally using replicated studies. Once reliable Kc values are in-hand, these Kc values are then used to adjust meteorological reference ETo to predict actual turf ETT as:
ETT = Kc x ETo [Eq. 2]
According to Eq. 1, it’s plausible that different Kc values will be required for different management scenarios because of the effects that HOC, and mowing and fertilization schedules have on actual turf ETT. Similarly according to Eq. 1 and Eq. 2, Kc values = 1 indicate that no adjustment is made to reference ETo from the weather station because ETT = ETo. Alternatively, Kc values > 1 and Kc values < 1 indicate the reference ETo predictions from the weather station under-estimate and over-estimate actual turf ETT, respectively.
Three years of testing at the Troll Turf Research & Education Center investigated the effects of HOC and N on actual turf ETT measured using weighing-lysimeters. Three cool-season turfgrass species were evaluated including creeping bentgrass (CB) as golf turf and pure stands of Kentucky bluegrass (KB) and perennial ryegrass (PR) as sportslawn turf. Species were fertilized in summer at two N rates (0 and 1 lb 1000 ft-2). All species were mowed at two HOC with KB and PR mowed at 1.25 and 2.50 inch while CB was mowed at 0.125 and 0.375 inch HOC. Daily turf ETT and reference ETo measurements were made and Kc values were computed daily during the summerirrigation period in July and August.
Actual ETT and reference ETo both co-vary with evaporative demand (meteorological factors). Reference ETo and turf ETT are highly variable from day-to-day and year-toyear but their ratios (i.e., Kc values) are relatively constant (Fig. 1). Month-to-month and year-to-year variation in Kc values are uniform and consistent in the cool-humid region of Massachusetts. As such, monthly and yearly ET are not important factors that need to be adjusted using Kc values when computing turf ETT in summer according to Eq. 2.
Crop Coefficients (Kc) for Recreational Turf Use
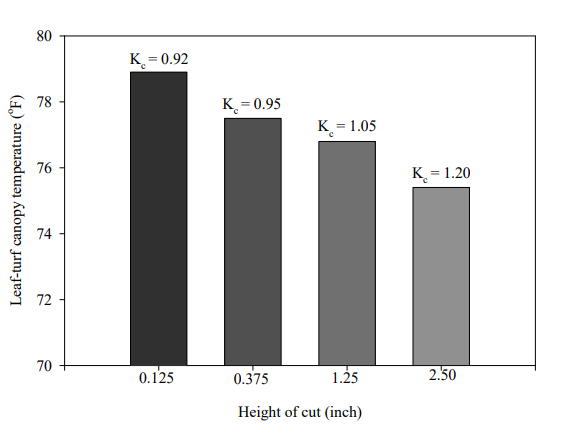
The challenge becomes selecting the most appropriate Kc value that best fits your turf management practices under irrigation (Fig. 2). Mowing HOC is the single most important cultural factor affecting Kc values for turf under irrigation (Table 1). Average (i.e., mid-point) Kc values in summer ranged from 0.92 (0.125 inch HOC) to 1.20 (2.50 inch HOC) which represents a 25% increase in irrigation requirements due to the effects of a taller HOC (Table 1). Taller grass canopies as discussed previously promote higher turf ETT and therefore higher Kc values (Eq. 1). Greater heat transfer with higher turf ETT under taller grass canopies promotes greater transpirational cooling, which lower turf canopy temperatures in summer by several degrees (Fig. 3).
Short grass canopies mowed at less than 1.0 inch HOC would have to be irrigated according to FAO-56 PM ETo using an average Kc values less than 1. Taller HOC turf would require Kc values greater than 1.0. Generally, Kc values increase incrementally with higher HOC above 1.0 inch with an increase of approximately 0.01 in Kc for every 0.1 inch increase in HOC. These guidelines assume, however, that turf is maintained under conditions where water applied as irrigation is not growth limiting.
Fertilizing with N in summer at 1.0 lb 1000ft-2 promoted only a 6% increase in Kc values when compared to unfertilized turf which is a relatively small increase compared to HOC. The fertilizer N-source used in this study (in summer) contained approximately 82% of the total N as slow-release, which has the capacity to lower leaf area and actual turf ETT compared to N-sources using more readily available forms of N. Practices such spoon-feeding with N in summer at reduce N rates (0.10 to 0.20 lbs N 1000ft-2) will help in reducing leaf area to lower Kc values.
Conditions or practices that have a greater capacity to increase leaf and shoot vigor can promote higher turf ETT and higher Kc values. The effects of these potential practices or conditions that influence turf ETT are reported in Table 1 as ranges from low to high for Kc values. These reported Kc ranges serve as guidelines for selecting the most appropriate Kc value depending on the HOC and your management conditions. For example, golf greens are mowed daily and golf fairways are mowed three times per week and therefore these short grass canopies will need less water as irrigation indicated by their Kc values < 1.0. However, because management practices are not uniform within any one HOC, practices or conditions that may reduce turf ETT will require adjusting Kc values down. Moreover, recreational turf under more intensive foot traffic causing greater thinning of the turf will require lower Kc values and less water as irrigation because of their reduced turf ETT rates.
Computing Turf ETT for Irrigation
Computing daily ET amounts using weather stations’ climatic data are relatively simple calculations. First, reliable reference ETo values are needed. Table 1 reports Kc values computed using reference ETo derived from FAO-56 PM ETo, which is a standardized procedure. Numerous companies offer weather stations and software that provide reference ETo values. A specific Penman or Penman-Monteith equation computes a slightly different reference value under identical meteorological conditions. Crop coefficients were calculated according to Eq. 1 using FAO-56 PM ETo. As such, FAO-56 PM ETo computed Kc values may vary slightly from other equations when using Kc values reported in Table 1. These Kc values presented in Table 1 may need some adjustment when using other weather stations that compute reference ETo using a different mathematical procedure.
According to Eq. 2, turf ETT = Kc ETo. To determine the amount of water to apply as irrigation (turf ETT), the following steps are recommended:
STEP 1. Select the best Kc value using Table 1. For example, if a golf green under irrigation is mowed at 0.125 inch HOC, a Kc value of 0.92 may be selected according to Table 1. Furthermore, if PGRs are routinely applied in summer at this HOC, then a lower Kc value of 0.89 (from Table 1) may be a more appropriate Kc value because of the lower turf ETT that would be expected when using PGRs. Lower Kc values will provide additional water savings for an irrigated site when lower water use (turf ETT) rates are expected because of the effects of turf maintenance practices (see Table 1 footnotes).
STEP 2. Retrieve daily reference ETo values (i.e., FAO-56 PM ETo) computed from a reliable (nearby) weather station. For this example, let’s assume the weather station computed reference ETo value was 0.14 inch over the previous 24 hour period.
STEP 3. Calculate the amount of water to be applied as irrigation using the Kc value from Table 1 followed by substituting the Kc value (0.89) and weather station computed reference ETo value (0.14 inch per day) into Eq. 2, where
Turf ETT = 0.89 x 0.14 inch = 0.13 inch.
For this example, 0.13 inch would be applied as irrigation.
Where a sports turf is mowed at a 2.00 inch HOC under similar evaporative (climatic) conditions (i.e., reference ETo = 0.14 inch per day), a Kc value of 1.11 may be selected according to Table 1. The amount of water applied as irrigation would be 0.16 inch per day after adjusting the reference ETo using the best Kc value (calculated as 1.11 0.14 inch per day = 0.16 inch per day).
Reference ETo values from weather stations will vary day-today with evaporative demand, and in turn, irrigation amounts as ET replacement will vary day-to-day. In the previous examples described above, 0.13 inch per day was calculated as ET replacement for the golf green while 0.16 inch per day (23% more as irrigation) was calculated as ET replacement for the taller sports turf. These irrigation amounts are based on the reference ETo values calculated by the nearby weather station from the previous 24 hour period. Assuming the same evaporative demand (i.e., reference ETo = 0.14 inch per day) and no rainfall, the cumulative (total) amount of water applied as irrigation (ET replacement) by the end of one week (7 days) would equal 0.91 and 1.12 inch as irrigation for the golf green and taller sport turf, respectively. In cool-humid environments rainfall may occur in summer during the irrigation season. In such cases the reference ETo after correcting using the appropriate Kc value will need to be adjusted by subtracting rainfall from the calculated turf ETT.
ET replacement = The amount of water applied as irrigation according to a weather station computed reference ETo corrected using the most appropriate crop coefficient.
In order to implement more effective irrigation scheduling and water management practices weather stations and associated software that calculate reference ETo should be updated to include standardized procedures ( FAO-56 PM ETo, Allen et al., 1998) and their equivalent procedures such as ASCE-EWRI standardized equation (Allen et al., 2005; Wherley et al., 2015). In addition, reference ETo used with calculated Kc values as reported in Table 1 require meteorological sensors to be routinely calibrated to ensure reliable measures for solar radiation, air temperature, wind speed, and relative humidity. This ensures the computation of reliable estimates for reference ETo from the weather station in computing reliable turf ETT estimates for irrigation according to Eq. 2.
Other Considerations
Irrigating turf under cool-humid conditions to replace that lost as turf ETT does not necessarily require daily irrigation using ET replacement. Tracking of daily reference ETo corrected for rainfall can be computed over several days. The sum total of all daily reference ETos for that period can be computed followed by adjustment (Eq. 2) using the most appropriate Kc value (Table 1). It is important to recognize that the period in days between irrigation events is distinctly different from computing daily ET replacement using Eq. 2. Where Eq. 2 is the computed “amount” applied as ET replacement, the days between irrigation are a “timing variable” which involves many aspects of the turf system’s drought resistance capacity (drought avoidance + drought tolerance mechanisms).
The timing of irrigation events is highly variable because drought resistance is under the influence of numerous soil, cultural, and environmental factors. For a detailed discussion of the guidelines for determining the efficient timing of irrigation see Turf Irrigation Series No. 2 entitled “Drought Resistance and Efficient Irrigation for the Cool-Humid Region”. In addition, timing of irrigation in terms of frequency of irrigation (days between irrigation) depends on the level of turf quality desired. Less frequent irrigation may be appropriate where lower turf quality standards are acceptable. Similarly, lower Kc values than those presented in Table 1 may be appropriate in some situations. However, major departures (i.e., arbitrary decreases) in Kc values may not support sufficient turf growth needed for optimal traffic tolerance. This research is currently lacking and results showing the impact of deficit irrigation levels on traffic tolerance are not available for cool-season turfgrass growing in Massachusetts. Recent research on deficit irrigation is available for warm-season turfgrass under traffic (Hejl et al., 2016). However, this research has little relevance to cool-season turfgrass under traffic and irrigation because of the higher tolerance for traffic and drought exhibited by warm-season turfgrasses.
The use of reference ETo and Kc values allows turf managers to effectively schedule irrigation to meet the consumptive water use demands of turfgrass. However, ET replacement using meteorological data from on-site weather stations is practiced by only 17% of all golf courses in the United States (Throssell et al., 2009). Implementing appropriate Kc values for use with on-site weather stations and meteorological data can effectively address water conservation and water quality concerns expressed by many advocates from the general public, as well as federal, state, and municipal regulators.
References
- Allen, R.G., L.S. Pereira, D. Raes, and M. Smith. 1998. Crop evapotranspiration: Guidelines for computing water requirements. Irr. & Drain. Paper 56. FAO, Rome, Italy.
- Allen, R. G., I.A. Walter, R.L. Elliot., T.A. Howell, D. Itenfisu, M.E. Jensen, and R. Snyder. 2005. The ASCE standardized reference evapotranspiration equation. ASCE and American Society of Civil Engineers.
- Hejl R.W., B.G. Wherley, R.H. White, J.C. Thomas, and C.H. Fontanier. 2016. Deficit irrigation and simulated traffic on ‘Tifway’ bermudagrass summer performance and autumn recovery. Crop Sci. 56:809–817.
- Poro, J., J. S. Ebdon, M. DaCosta, and P. W. Brown. 2017. Effects of mowing height of cut and nitrogen on FAO-56 PM crop coefficients for recreational turf in the coolhumid region. Crop Sci. 56:1–11.
- Throssell, C.S., G.T. Lyman, M.E. Johnson, G.A. Stacey, and C.D. Brown. 2009. Golf course environmental profile measures water use, source, cost, quality, and management and conservation strategies. Online. Appl. Turfgrass Sci. doi:10.1094/ATS-2009-0129-01-RS
- Wherley, B., M.D. Dukes, S. Cathey, G. Miller, and T. Sinclair. 2015. Consumptive water use and crop coefficients for warm-season turfgrass species in the southeastern United States. J. Agric. Water Manage. 156:10–18.
Table 1. Crop coefficients (Kc values, adapted from Poro et al., 2017) for adjusting daily FAO-56 PM ETo computed by weather stations for irrigated turf. These Kc values are appropriate for cool-season turfgrass used for recreational turf in Massachusetts and other similar cool-humid climatic environments. Crop coefficients were computed for recreational turf maintained under favorable soil moisture for optimal growth at different heights of cut (HOC) and management levels.
| HOC, inch † | Crop coefficients (Kc values) | ||
|---|---|---|---|
| Low range ‡ | High range ¶ | Mid-Point# | |
| 0.125 | 0.89 | 0.95 | 0.92 |
| 0.375 | 0.92 | 0.98 | 0.95 |
| 0.50 | 0.93 | 0.99 | 0.96 |
|
0.75 |
0.96 | 1.02 | 0.99 |
| 1.00 | 0.99 | 1.05 | 1.02 |
| 1.25 | 1.02 | 1.08 | 1.05 |
| 1.50 | 1.05 | 1.11 | 1.08 |
| 1.75 | 1.08 | 1.14 | 1.11 |
| 2.00 | 1.11 | 1.17 | 1.14 |
| 2.25 | 1.14 | 1.20 | 1.17 |
| 2.50 | 1.17 | 1.23 | 1.20 |
†HOC tested included creeping bentgrass mowed at 0.125 and 0.375 inch HOC, and 1.25 and 2.50 inch HOC for Kentucky bluegrass and perennial ryegrass. Other reported Kc values were derived from statistical fitting. For Kc values outside these tested HOC ranges, Kc values may be adjusted up by 0.01 per 0.10 inch increase in HOC.
‡Low range Kc values are most appropriate for conditions of lower leaf area and reduced shoot vigor caused by lower N, spoon-feeding, PGR use, frequent mowing, high traffic, and greater thatch or soil compaction tendencies.
¶High range Kc values are most appropriate for conditions of higher leaf area and favorable shoot vigor caused by higher N use, low traffic, infrequent mowing, fungicide use, and lower thatch or soil compaction tendencies.
#Mid-point Kc values are most appropriate for average conditions of leaf area and shoot vigor.
Figure 1. Crop coefficients (Kc values) calculated as the ratio of actual ETT-to-reference ETo are uniform from month-to-month and year-to-year in the cool-humid region of Massachusetts.
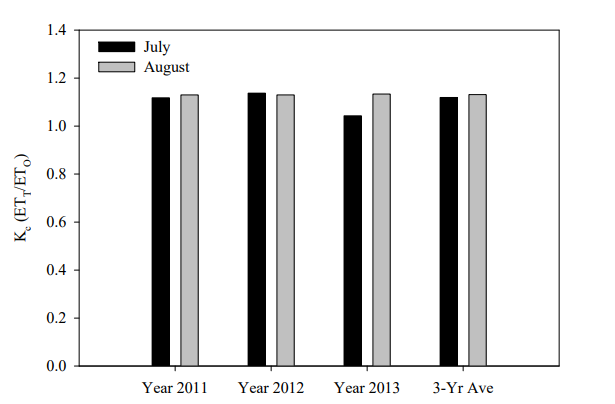
Figure 2. Reference ETo calculated using mathematical equations such as FAO-56 PM ETo are derived from meteorological data and need to be adjusted using Kc values to match the actual ETT of the turf under irrigation. Inappropriate Kc values may cause overwatering (i.e., Kc values too high) or dehydration stress (i.e., Kc values too low) for irrigated recreational turf grown under the same evaporative (climatic) conditions (i.e., same reference ETo). Crop coefficients (Kc values) need to adjust for different turf ETT caused by the effects of management.

Figure 3. Increasing height of cut (HOC) promotes higher turf ETT rates and increases crop coefficients (Kc values). Greater transpirational cooling (heat transfer) results from higher turf ETT with taller HOC, which decreases leaf-canopy temperatures. Leaf-canopy temperatures were measured under clear sky in August at the Troll Turf Research & Education Center, South Deerfield, MA.
Turf Irrigation Series No. 2: Drought Resistance and Efficient Irrigation for the Cool-Humid Region
Water Conservation
When rainfall is insufficient and water resources become limited, supplemental irrigation needed to sustain landscape plantings such as turf is often the first to be placed on water use restrictions. Under such restrictions professional turf managers and homeowners are forced to maintain turf function and acceptable turf quality with less water applied as irrigation. In some cases when no irrigation is permitted, turf consumptive water use must be met by natural precipitation events as rainfall. However, if turf water use requirements are to be met by precipitation events alone they must be distributed to conform to turf needs, which do not necessarily correlate in dry summers.
In such cases, water conservation strategies and efficient irrigation practices are needed to maintain turf; these practices may include:
- incorporating water-use-efficient plant material into the landscape
- implementing water conserving management practices, and
- maximizing irrigation efficiency by controlling leaching, pooling or ponding of irrigation water, and surface water as runoff.
Even in areas where water shortages are rare events, judicious and careful planning in anticipation of drought is extremely important. Planning and implementation of water conservation strategies are not necessarily practices that provide immediate results but rather may take significant time and continued effort before measured water savings are achieved.
Alternatively, over-use of water as supplemental irrigation must be avoided in summer because over-watering can have adverse impacts on turf function and environmental health, which may include:
- diminished rooting, and water and nutrient acquisition
- higher potential for leaching and mobility/movement of water and contaminants into ground water
- increased soil compaction tendencies and higher lateral transport of water and contaminants to surface water
- increased and elevated shoot (tissue) water content that inhibit the turfgrass’ tolerances to physiological stress (heat, cold or drought) and wear (traffic)
- greater leaf wetness and the resulting increased potential for disease occurrence and severity, particularly for those diseases which are active in summer when supplemental irrigation is used
- higher evapotranspiration (ET) rates and greater soil moisture depletion rates in summer
- diminished drought resistance caused by elevated ET and shallow rooting
- the need for more water as irrigation in both the amount applied and the frequency of irrigation, and
- increase irrigation system maintenance and the cost of water due to higher water usage.
Meeting but not exceeding the water use requirements of turfgrass is important, and irrigating with less water is always preferred to over-watering. In addition, allowing for natural rainfall (as precipitation) to meet some of the turfgrass’ water use requirements can help to replace in part the need for supplemental irrigation. Rainfall precipitation rates, duration, and frequency can vary from location-to-location but these additions of water are “free” and of good quality and therefore must be taken into account when scheduling irrigation in order to conserve water applied as supplemental irrigation. Natural precipitation events are not necessarily effective in meeting some fractional level of the turf’s water use requirement because some rainfall as precipitation may exceed soil infiltration rates and may be sufficient to cause runoff while other events may exceed rooting depth and cause leaching.
Both runoff and leaching reduce “precipitation efficiency” because these additions do not provide any value for turf use and in turn, increase the need for supplemental irrigation. Precipitation efficiency can be defined as the relative amount of water in the foliage and root zone utilized by the turf and is available as ET following rainfall or irrigation. All turfgrass systems from high-maintenance turf under irrigation to lower value turf without irrigation can benefit from increased precipitation efficiency.
Precipitation efficiency = The proportion of precipitation (rainfall) available for turf evapotranspiration. Any conditions or practices that promote runoff or leaching from the turf system reduces precipitation effectiveness and increases supplemental irrigation requirements. Adjusting irrigation requirements by correcting (subtracting) rainfall amounts from ET-based irrigation is a form of enhancing precipitation effectiveness because such adjustments diminish leaching.
Precipitation efficiency as rainfall or as supplemental irrigation can be increased by ensuring the following:
- maintain good turfgrass cover to reduce runoff and increase soil infiltration
- maintain good turfgrass cover and soil shading to reduce evaporative water loss
- control weeds that compete with desirable turfgrass for water
- increase soil moisture retention of droughty root zones with additions of appropriate peat moss or other organic amendments to amend sandy soils
- increase surface and internal drainage of poorly drained root zones with additions of appropriate amendments and establishment of proper surface grades to avoid surface water runoff
- maintain ET rates of turfgrass using ET replacement with sufficient soil drying between intervals to allow soil moisture depletion and to promote higher soilwater storage capacity to utilize precipitation; i.e., avoid turf dormancy
- maintain deeper rooting to allow for higher soil-water storage capacity to utilize precipitation; i.e., avoid turf dormancy
- alleviate and control for high soil compaction tendencies to promote rooting and increase soil infiltration rates
- alleviate and control for high thatch tendencies to promote rooting and to increase soil infiltration rates
- use multiple cycling under irrigation on soils with low infiltration rates
- adjust irrigation to correct for rainfall, and
- use wetting agents to promote uniform wetting and increase soil infiltration rates.
These strategies that are targeted at increasing precipitation efficiency help to lengthen the days between supplement irrigation. Moreover, they increase the storage capacity of the plant-available soil-water reserve or facilitate recharge and therefore increase the likelihood of rainfall as “free water” to meet the water use requirements of turf.
How much water is enough?
The irrigation of turf using ET replacement is effective in preventing leaching losses and therefore eliminates potential sources of waste, which is an important water conservation strategy. However, repeated and daily use of irrigation applied as ET replacement is a form of over-use of water because daily watering diminishes rooting depth by inhibiting the turfgrass’ ability to effectively redistribute deeper rooting into the soil profile. The scheduling of irrigation using ET replacement helps to quantify water in terms of the “amount” in inches to be applied to turf. Scheduling of irrigation using ET rates is highly variable (see Turf Irrigation Series No. 1 entitled “Use of Meteorological Data to Estimate Irrigation Requirements of Recreational Turf: Evapotranspiration and Crop Coefficients for the Cool-Humid Region”) and is just one factor among several that must be taken into consideration in developing an effective irrigation program.
In addition to the amount applied as ET replacement, the scheduling of irrigation is also determined by the “timing” of an irrigation event such as “days between irrigation”. The scheduling of irrigation as a timing event is highly variable because the days between irrigation are affected by precipitation efficiency described above. In addition, conditions and practices that increase precipitation efficiency help to lengthen the irrigation cycle and therefore decrease irrigation frequency. Decreasing the irrigation frequency is equivalent, for example, to adjusting from irrigating daily using a 1-day cycle (high frequency) to irrigating on a 7-day cycle (low frequency), which allows for greater soil drying between cycles.
Soil drying between irrigation events promotes the following:
- decreases soil compaction tendencies under traffic
- diminishes shoot water content and increases physiological stress tolerance
- reduces leaf wetness and disease severity
- allows for greater soil-water recharge potential with less water loss as runoff promotes greater rooting depth with less water loss as leaching, and
- increases precipitation efficiency.
The frequency of irrigation also decreases with the following practices and conditions:
- Lower ET rates promoted by
- use of slow release N or no nitrogen in summer
- spoon-feeding with foliar N o regular mowing according to the 1/3 rule
- use of appropriate height of cut (see Figure 1)
- use of appropriate PGRs in summer o use of wilt-based irrigation in summer
- correcting for soil potassium (K) deficiencies, and
- use of deficit irrigation (applying less than 100% ET replacement).
- Deeper rooting promoted by
- alleviating excessive thatch and soil hardness as compaction
- correcting for strongly acidic soil pH
- maintaining 100% grassy cover and soil shading
- use of slow release N or no nitrogen in summer
- spoon-feeding with foliar N
- use of appropriate height of cut (see Figure 2)
- use of wilt-based irrigation in summer (see Figure 3)
- maintaining ET rates using ET replacement in summer to promote heat transfer and soil and plant cooling
- avoiding excessively close HOC causing turfgrass thinning, and
- use of deficit irrigation (applying less than 100% ET replacement).
Lower ET and deep rooting are plant factors associated with superior drought resistance. These plant characteristics lengthen the time between irrigation events and increase precipitation efficiency. As such, the twenty or more conditions or practices outlined above and presented in Table 1 and which are associated with increased drought resistance and precipitation efficiency, indicate that there are numerous opportunities for turf managers to increase water conservation.
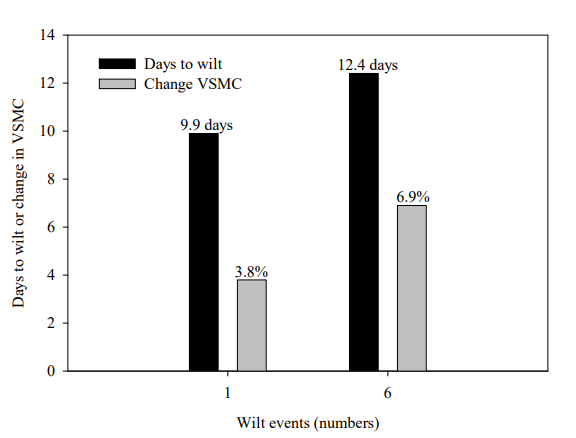
The irrigation “timing interval” can be highly variable because drought resistance and precipitation efficiency vary from site-to-site. In addition, the greater the number of drought resistance and precipitation efficiency practices that are implemented and incorporated into the turf management program, the greater the water savings and the greater the interval (in days) between irrigation events. Poor practices will shorten the irrigation cycle (interval) while appropriate practices, including both their quality and numbers will lengthen the irrigation cycle. For example, irrigating at early symptoms of leaf dehydration (i.e., 50% wilt, leaf-fold and leaf-roll) is a timing event that is appropriate for turf. However, the benefit of “wilt-based irrigation” and its capacity to increase rooting depth requires repeated exposures to wilt in order for drought resistance benefits to fully develop (see Figure 3).
Wilt-based irrigation = Wilting tendency is a timing variable for initiating irrigation while tracking daily ET is the amount applied as irrigation. Allowing for wilt (mild plant dehydration) encourages greater soil drying and promotes less runoff and leaching that increases precipitation effectiveness.
In turf areas where lower turf quality and turf function are acceptable, the practice of deficit irrigation replacement may be implemented. Deficit irrigation replacement recommends applying some fractional level of actual turf ET, where actual turf ET is derived using the expression:
Turf ETT = ETo x Kc [Eq. 1]
Deficit irrigation = Is a variation on ET replacement where some fractional level of irrigation is applied at less than 100% of ET. Irrigation amounts (ET replacement) computed using weather stations are adjusted down to save water but also promotes greater soil and plant water deficits that lower turf quality and function. Actual deficit replacement levels (90, 80, or 70% of ET) and the timing of irrigation are dependent on numerous factors related to turf drought resistance and moisture retention of the site.
Turf ETT is the amount of water lost from the turf system (as evaporative water loss from the soil surface plus transpirational water loss from associated leaf surfaces) and is the amount applied as irrigation. ETo is the reference ET (prediction) calculated by a nearby weather station using meteorological data, and Kc (crop coefficient) is the appropriate correction factor to adjust reference ETo to match actual turf ETT. For greater detail and discussion of Eq. 1 please see Turf Irrigation Series No. 1 entitled “Use of Meteorological Data to Estimate Irrigation Requirements of Recreational Turf: Evapotranspiration and Crop Coefficients for the Cool-Humid Region”.
Turf ETT estimated using Eq. 1 applies irrigation at 100% of ET replacement. Deficit irrigation is used to adjust actual turf ETT down (i.e., deficit replacement) by applying irrigation at some fractional level less than 100% of ET. In deficit irrigation, actual turf ETT calculated using Eq. 1 is applied at some deficit irrigation replacement level (i.e., < 1 or < 100%) according to the expression:
Deficit irrigation = Turf ETT x Deficit replacement (0.90 or 0.80 or lower) [Eq. 2]
substituting Eq. 1 into Eq. 2
Deficit irrigation = (ETo x Kc) x (0.90 or 0.80 or lower) [Eq. 3]
Deficit irrigation replacement will allow for greater water savings because less water is applied (i.e., 0.70 vs. 0.80 vs. 0.90) relative to 100% of turf ETT replacement. For example, if the reference ETo computed by a nearby weather station since the last irrigation of a golf course fairway turf is 0.80 inch, and the appropriate Kc value for the golf fairway is 0.95, then according to Eq. 1:
Turf ETT = 0.80 inch x 0.95 = 0.76 inch
It would follow that irrigation of the golf fairway turf using 0.80 inches as ET replacement (i.e., 100% of ET replacement) could be applied. Using deficit irrigation replacement level of 80% of actual turf ETT (i.e., 20% water savings relative to 100% of turf ETT), further adjustments could be made using Eq. 2 (or equivalently Eq. 3) as:
Deficit irrigation = 0.76 inch (from Eq. 1) x 0.80 (deficit level) = 0.61 inch
After adjusting actual turf ETT to 80% deficit irrigation replacement, 0.61 inch of water could be applied as irrigation with a resulting 20% water savings compared to 100% ET replacement (i.e., 0.61 vs. 0.76 inch applied as irrigation at 80 and 100% ET replacement, respectively).
It’s important to note that crop coefficients (Kc values) adjust reference ETo values (up or down) to account for specific maintenance practices and their effects on turf ET in order to compute (using Eq. 1) the most reliable (accurate) prediction of actual turf ETT. Unlike crop coefficients, however, deficit irrigation replacement levels are adjustments to weather station computations of turf ETT (calculated using Eq. 1) and are downward adjustments of turf ETT (i.e., ET deficits).
Repeated use of deficit irrigation (using Eq. 2 or Eq. 3) provides additional water savings (conservation). However, when compared to 100% ET replacement (Eq. 1), long term water deficits may cause greater dehydration stress and the potential loss in turfgrass quality and function, and therefore should not be used on high priority areas such as golf greens and tees or sport grass under intense traffic (DaCosta and Huang, 2006). Lower deficit irrigation replacement levels (i.e., 70%, 80%, 90% of ET replacement) may be more appropriate where rapid growth for recovery under traffic are less important such as golf fairways and rough areas, and lawn turf.
However, using 100% ET replacement as the amount applied as irrigation along with wilt-based irrigation as the timing variable combines some of the benefits from soil drying (see above) along with the benefits of ET replacement (i.e., diminished leaching potential with soil and transpirational cooling). The proper deficit irrigation replacement level and the timing variable for your turf will vary with (i) the turfgrass species’ and cultivars’ capacity to tolerate the drought imposed by the specific deficit level, (ii) the factors affecting precipitation efficiency, and (iii) the factors affecting drought resistance immediately before and during implementation of deficit irrigation replacement.
Other Considerations
Soil water available for plant growth is highly variable because of the numerous factors affecting plant-available soil-water including rooting depth, soil texture, soil layering, soil infiltration rates, soil permeability rates, and soil moisture depletion rates (i.e., ET). Such variability is unknown even where uniform, artificial root zones are constructed. However, knowledge of the amount of soil water held in storage for plant use is not necessary when using ET replacement to schedule irrigation events. The practices outlined above that increase precipitation efficiency and drought resistance insure greater soil water available as ET. Therefore, estimating daily ET and tracking daily ET corrected for rainfall can effectively estimate how much water to apply while when to water may follow visual drought stress symptoms such as wilt or some other performance standard such as minimum turf quality or green cover (Hejl et al., 2016). Similarly, the timing event or the interval between irrigation will follow the precipitation efficiency and drought resistance aspects of the turf under irrigation (Table 1).
Implementing the appropriate water conserving practices allows turf managers to effectively schedule irrigation using less water by lengthening the irrigation cycle. To that end, (i) estimating ET using meteorological data collected by weather stations, (ii) improving the turfgrass’ drought resistance capacity to maintain function with less precipitation (irrigation and rainfall), and (iii) improving the effectiveness of the site to capture and store precipitation are important and effective strategies. These water conservation strategies will also effectively address the many concerns expressed by advocates from the general public, as well as federal, state, and municipal regulators regarding the need to conserve water and to eliminate waste in turf systems.
References
- DaCosta, M., and B. Huang. 2006. Minimum water requirements for creeping, colonial, and velvet bentgrasses under fairway conditions. Crop Sci. 46:81–89.
- Hejl R.W., B.G. Wherley, R.H. White, J.C. Thomas, and C.H. Fontanier. 2016. Deficit irrigation and simulated traffic on ‘Tifway’ bermudagrass summer performance and autumn recovery. Crop Sci. 56:809–817.
- Lanier, J.D., J.S. Ebdon, and M. DaCosta. 2012. Physiological changes associated with wilt-induced freezing tolerance among diverse turf performance perennial ryegrass cultivars. Crop Sci. 52:1393-1405.
- Poro, J., J. S. Ebdon, M. DaCosta, and P. W. Brown. 2017. Effects of mowing height of cut and nitrogen on FAO-56 PM crop coefficients for recreational turf in the coolhumid region. Crop Sci. 56:1–11.
Table 1. Conditions and practices that increase precipitation efficiency (rainfall and irrigation) and the turf’s capacity to store soil water for ET utilization.
| By increasing rooting | by decreasing leaching | by decreasing runoff |
|---|---|---|
| Appropriate HOC, irrigated | Avoiding turf dormancy | Appropiate surface drainage |
| Approppriate HOC, non-irrigated | Deeper rooting | Avoiding turf dormancy |
| Appropriate internal drainage | ET replacement | Controlling for thatch and soil compaction |
| Deficit irrigation replacement | ET replacement corrected for rainfall | Deficit irrigation replacement |
| Favorable soil pH | Increase soil water retention | Maintaining active turfgrass cover |
| Low N as spoon-feeding |
Maintaining dense-active turf cover |
Multiple cycling of irrigation |
| Low N as SRN | Use of wetting agents | |
| Low soil compaction tendencies | Wilt-base irrigation | |
| Low thatch tendencies | ||
| Wilt-base irrigation |
Figure 1. The effects of height of cut (HOC) on evapotranspiration rate (ET) measured in summer under irrigation. Short grass turf (creeping bentgrass, CB) mowed at greens and fairway HOC use approximately 20% less water as ET compared to taller HOC turf (Kentucky bluegrass, KB, and perennial ryegrass, PR). No significant difference in ET rates between greens and fairway HOC are observed. Decreasing the HOC of taller grass from 2.50 to 1.25 inch significantly reduces ET rates by 7%. There is a 0.015 inch increase in weekly ET rates (and irrigation requirements) for each 0.10 inch increase in HOC. Vertical bars with the same letter are not statistically different. From Poro et al. (2017).
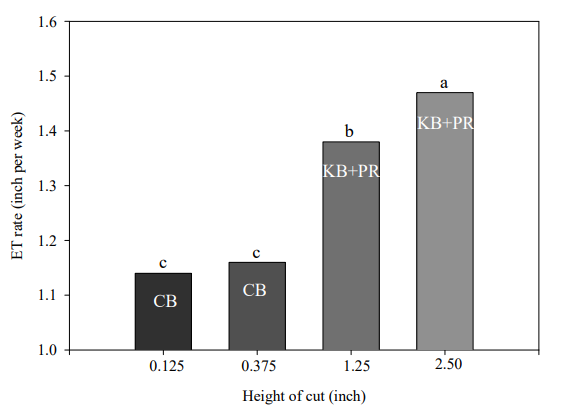
Figure 2. The effects of height of cut (HOC) on rooting density in the deepest portion of the soil profile (10 to 18 inch soil depth) measured in summer under irrigation. Deep rooting is especially sensitive to HOC and is important for acquisition of soil water under drought and irrigation. Short grass turf (creeping bentgrass, CB) mowed at greens and fairway HOC exhibited 60% less rooting density compared to taller HOC turf (Kentucky bluegrass, KB, and perennial ryegrass, PR). No significant difference in rooting density is observed between greens and fairway HOC or between taller HOC turf mowed at 1.25 to 2.50 inch. A decrease in HOC within the accepted range for the species does not necessarily diminish deep rooting in summer while lower ET rates may be observed under irrigation (see Figure 1). However, lower HOC in summer that cause significant grass thinning may inhibit rooting. Vertical bars with the same letter are not statistically different. From Poro et al. (2017).
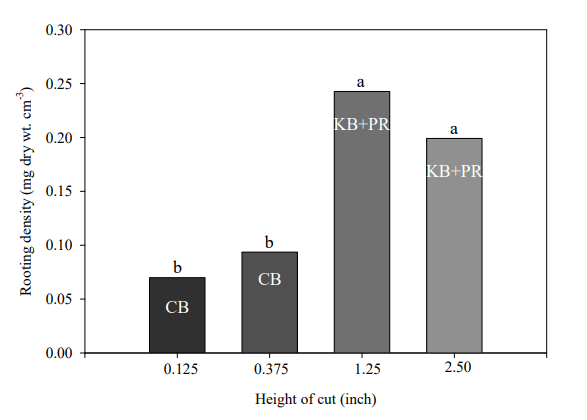
Figure 3. Wilt-irrigation comparing one wilt-event with six wilt-events and its effects on days-to-wilt (number) and changes in volumetric soil moisture content (VSMC). Irrigation was applied using 100% ET replacement when perennial ryegrass reached 50% wilt. Perennial ryegrass was mowed at 2.0 inch height of cut. Six wilt events added 2.5 days to the irrigation interval when compared to one wilt event. The added days-to-wilt using six wilt-events was due to the greater rooting density at the 14-inch soil depth indicated by greater soil moisture depletion (i.e., changes in VSMC). From Lanier et al. (2012).