Does Selecting the Best Turfgrass Varieties Really Matter?
Much has been written on selecting the right turfgrass species for various turf uses. The UMass Amherst Extension Turf program, as well as other institutions have developed numerous fact sheets, bulletins, and best management guides that are available for choosing the best species for traffic, shade, drought, infertility as well as many other turf related stresses. Turfgrass selection at the species level is a relatively straightforward process because fewer than 10 turfgrass species and subspecies are available for planting in the cool-humid regions such as New England. Decision-making for selecting the best variety (cultivar) is a greater dilemma because cultivars can number in the hundreds within a single species, in comparison to the very manageable number of turfgrass species.
The adaptability and tolerances of cultivars to turf related stresses relies heavily on the genetic diversity inherent in each species. Oftentimes it is the variety or cultivar, rather than the species which is the weakest link in the genetic chain. Like unadapted species, improper cultivar choice can result in thinning and a significant loss in turf density, due to diseases and various other biotic and abiotic stresses. Active turf stresses can cause the ingress of annual grassy weeds and broadleaf weeds, increasing maintenance costs in terms of water, fertilizer, and pesticides, as well as the cost of re-establishment.
National Turfgrass Evaluation Program (NTEP)
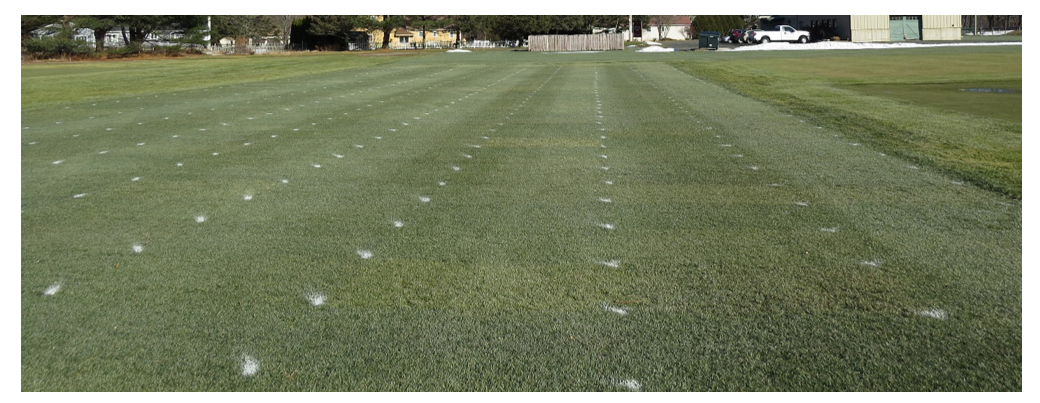
The National Turfgrass Evaluation Program (NTEP) generates valuable information about turfgrass performance of cultivars for the major cool-season turfgrass species including Kentucky bluegrass, perennial ryegrass, fine leaf fescues, tall fescue and bentgrass species (creeping, colonial and velvet bentgrass) as well as major warm-season turf species. Established in 1981, NTEP is a self-supporting, non-profit (501c3) organization with its headquarters on the USDA campus in Beltsville, MD. NTEP tests and the number of entries evaluated have increased greatly in the past few years - the current (2018) national tall fescue test has 132 entries under evaluation. This makes decisions about cultivars more difficult for consumers, including golf course superintendents and homeowners (see photos 1 and 2). To use NTEP information in the most responsible and effective manner, it is important to properly interpret NTEP data when select the best turfgrasses for blending or mixtures of two or three species.
Photo 1 (above). Aerial view of the 2017 NTEP Kentucky bluegrass test showing 89 entries and three replicates for a total of 267 plots at UMass Amherst (South Deerfield MA) Troll Turf Research & Education Center. This single test is replicated at 20 different NTEP test locations throughout the cool-season turfgrass growing region.
Photo 2 (above). Ground level view of the 2016 NTEP perennial ryegrass test showing 114 entries and three replicates for a total of 342 plots at UMass Amherst (South Deerfield MA) Troll Turf Research & Education Center. This single test is replicated at 23 NTEP test locations throughout the cool-season turfgrass growing region.
NTEP results are available online (http://wwww.ntep.org) at no cost to the consumer. Raw data is submitted to NTEP by major land-grant (state) universities as replicated plots evaluated by experienced turf raters and investigators. The single most important data submitted by university cooperators is turf quality (TQ), rated on a scale of 1 to 9 with 9 being ideal (best) quality. Turf quality is an overall assessment of the cultivar’s density (higher density), uniformity (smoothness), texture (i.e., finer leaf width) and genetic color (i.e., darker green), affording higher TQ.
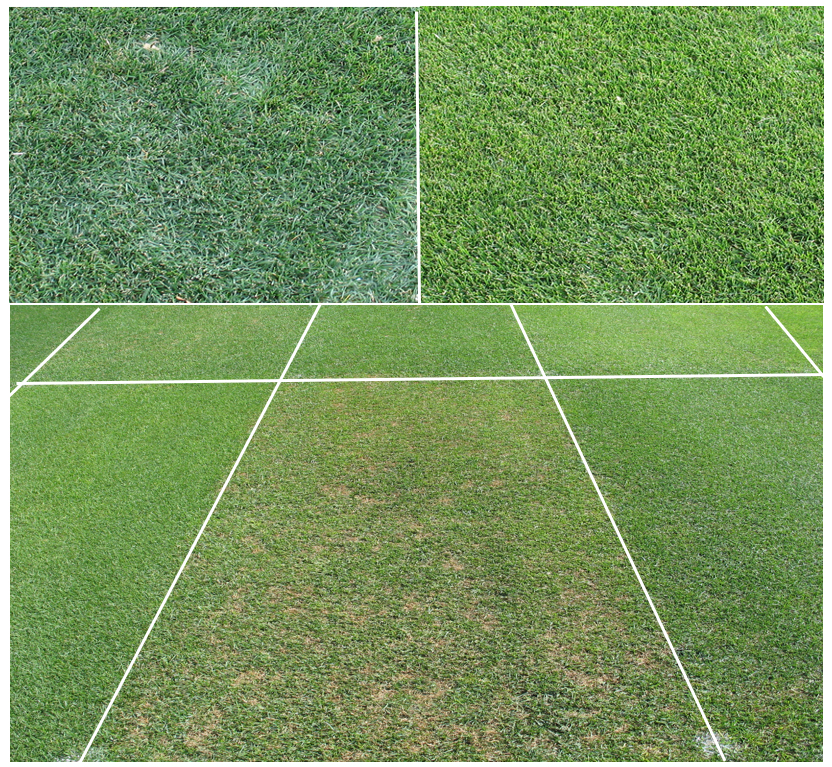
In addition to overall TQ, the individual components of TQ (color, texture, uniformity, density, freedom from weeds, disease and other stresses) are also reported in NTEP progress reports (see Photo 3 below). The individual TQ components are very useful when making selections for blending of two or more cultivars for a more uniform turf stand. Furthermore, NTEP cooperators will report data on disease activity, mowing quality, winter hardiness, spring green-up and many other traits and stresses active on the turf plots during the growing season; using the 1 to 9 rating scale, for example, 9=no disease or 9=no injury. Also, some NTEP cooperators are contracted by NTEP to evaluate traffic, shade, and drought resistance. There may be as many as 50 different traits evaluated and measured by university cooperators.
Photo 3. NTEP publishes all aspects of turf quality including genetic color differences (upper panel) among cultivars as well as differences between cultivars in turf density (lower panel). Color data (1 to 9, 9 = darkest) is useful for blending of cultivars to ensure uniform color. Turf density data (1 to 9, 9 = densest) is a good indicator of a cultivar’s tolerance to close mowing height as shown above for these Kentucky bluegrass cultivars mowed a ½ inch.
NTEP trials are planted and then evaluated over a five-year period in order to fully assess the sustainability and persistence of the cultivar. As the turf stand ages and stresses on the turf plots accumulate with years, the performance (TQ) of the cultivar changes. How a grass performs during the early years (1st and 2nd year) of the test is not necessarily predictive of how the cultivar persists through the later years of the test (3rd to 5th year). The sustainability of a turf is all about selecting cultivars with acceptable TQ (> 6) based on the later years of the test. See Figure 1, below.
Figure 1. Turf quality showing three cultivars of Kentucky bluegrass evaluated over a five-year period taken from the 1990 NTEP Kentucky bluegrass test. This test evaluated 125 entries. During the early years of the test “Ram I” was acceptable in TQ but TQ declined in the later years of the test. Conversely, “Blacksburg” was unacceptable during the early years of the test but was acceptable in the later years.
During each year of a 5-year test, NTEP publishes Progress Reports on all data collected for that year from each NTEP test site. There may be as many as 25 different test sites or locations evaluating the same roster of cultivars as replicated plots. At termination and completion of the test, NTEP publishes all data for all years and locations (test sites) as a Final Report. Turf quality of cultivars, taken from NTEP progress reports or final reports from the later years of the test is the most reliable selection criterion for sustainability and persistence.
NTEP collects monthly turf quality data that is averaged and reported as yearly TQ. Monthly TQ is useful for assessing how cultivars perform throughout the individual growing months and season from late-winter/early-spring to late-fall/early-winter. It is unusual for a single cultivar to have the capacity to “shine” throughout the entire growing season. Therefore, careful blending of two or more compatible cultivars that provide acceptable and season long TQ is recommended (see Figure 2).
Figure 2. Seasonal turf quality comparing two cultivars (A and B) with distinctly different seasonal turf quality. Cultivar “A” exhibits acceptable TQ during early spring green-up and outstanding spring and fall TQ. However, cultivar “A” exhibits unacceptable summer TQ. Unlike cultivar “A”, cultivar “B” has acceptable summer TQ whereas this cultivar is slow to green-up in the spring. Blending of these two cultivars as part of a two-way blend will provide acceptable TQ throughout the entire growing season.
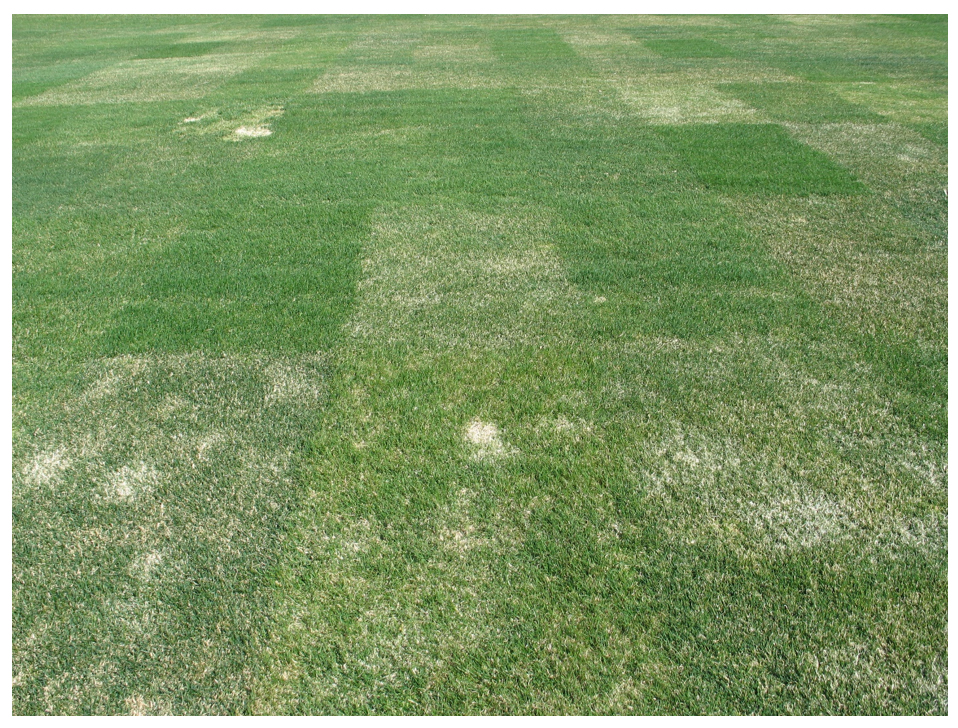
In Figure 2 the two cultivars (A and B) have similar yearly averages, however, each cultivar (A and B) have strengths and weaknesses according to their monthly TQ. These strengths and weaknesses can be exploited by blending (mixing) to ensure season-long acceptable TQ. Turf stands planted to 2 or 3 cultivars with similar performance qualities as cultivar “A” will show poor summer quality while a 2 or 3-way blend of cultivar “B” type quality performance would show poor early spring TQ. In addition, cultivar “B” would not be very tolerant of athletic traffic in early spring whereas cultivar “A” would be better adapted to traffic in early spring (see Photo 4 below).
Photo 4. Early spring green-up (April) among Kentucky bluegrass cultivars as part of the 2005 NTEP Kentucky bluegrass test. Some cultivars show active early spring growth and good green color while others are inactive. There were 110 cultivars evaluated as part of the 2005 NTEP test (South Deerfield, MA) conducted at the UMass Amherst Joseph Troll Turf Research & Education Center.
Statistics Matter
The results reported by NTEP are replicated across years (5 years), replicates (3 reps) and locations (20 to 25 locations) for each of the six (6) major cool-season turfgrass species evaluated by NTEP. In the larger tests (Kentucky bluegrass, perennial ryegrass, and tall fescue) with 100 or more entries, it is conceivable that 50,000 data points for TQ alone must be analyzed (summarized) by NTEP, a daunting task. To that end, statistics is important in summarizing NTEP data efficiently and accurately, and without any loss in information. In field evaluations conducted by NTEP, there is significant “noise” which can cause a loss in accuracy of the data and reduces the reliability of the NTEP results. In the perfect statistical world without noise, scientists would not have to replicate, and would only need to plant one plot for each cultivar. The reality, is however, field data is very “noisy.” In order to assess noise in the data (i.e., error or variability) two common statistical calculations are presented with all NTEP results: include (1) Least Significant Difference (LSD) and (2) Coefficient of Variation (CV). Understanding these two statistical terms is vital to the proper interpretation and appropriate use of NTEP results.
In Figure 3 below, some data is less trustworthy than other data. The noise (variability or error) is so great in some data (see cultivar B, Figure 3), any significant TQ difference may be presented as insignificant in NTEP progress reports or final reports. The LSD defines the minimum difference between two (cultivar) means needed for the means or averages to be statistically different. Most scientists are willing to accept an error rate of 5% and in turn, two cultivars are statistically different in TQ when their mean difference exceeds the LSD (0.05) value. Smaller LSD (0.05) values indicate greater differences can be observed in TQ between cultivars in a large roster of cultivars while larger LSD (0.05) values indicate less reliable data and therefore detecting statistical differences between cultivars can be more difficult. Similarly, smaller CV values indicate more reliable data. In general, smaller LSD (0.05) values will follow as CVs become smaller and the data becomes more reliable because both CVs and LSDs are derived from noise.
Figure 3. When reviewing NTEP data it is important to take notice of the LSD and CV values that are included in all NTEP reports. The university turf scientist responsible for collecting and submitting TQ data to NTEP are willing to accept an error rate of 5% [i.e., LSD (0.05)]. As such, when statistical differences exist in TQ according to the LSD (0.05) value, any statistical difference in TQ is the result of the “cultivar effect” (with a 95% certainty) and the remaining 5% is random error or “noise.”
Table 1 is an abbreviated table showing typical formatting of NTEP data and statistics. Locations (test sites) are abbreviated using NTEP codes; presented as part of any progress or final NTEP report (i.e., MA1: Massachusetts site; ME1: Maine site, OH1: Ohio site). Note that in any NTEP report the total number of test sites (20 to 25) are included. The entry column (color coded as purple) is the list of entries (cultivars). In this abbreviated list, two (2) entries are experimental (B5-45, GO9LM9) and three (3) entries are commercially available cultivars (Limerick, Arrow, Wellington). This abbreviated list of entries is small in comparison to the large roster of experimental and commercial entries typical of most NTEP trials (see Photos 1 and 2).
Table 1. Turf quality ratings taken on 173 Kentucky bluegrass entries from the 5th year (final year) of a completed NTEP test
Note that the TQ in Table 1 is from the final year of the NTEP test. Therefore, they have been under evaluation for 5 years! The Mean column (color coded as blue) contains TQ ratings averaged across all locations (also called the overall average). All entries and their TQ averages (means) for individual locations (MA1, ME1, OH1) are ordered from highest to lowest overall average. Note also that the order of entries for TQ within a location (MA1, ME1, OH1) do not necessarily follow the order (top to bottom) for TQ presented in the Mean column. This is because averages taken across all locations (overall averages) are not necessarily effective in predicting how a cultivar performs at a specific test location. For example, the top TQ performing entry according to the Mean column (color coded as blue) is the experimental BS-45, which exhibits acceptable TQ (TQ >6) in Maine (ME1), but is unacceptable (TQ< 5) at the Massachusetts location (MA1). Turf quality averages across locations (overall averages) should only be used as a general guide and not used for selecting cultivars for planting at a specific location.
In any NTEP test, especially in the early years of the test, many of the entries are experimental and therefore not commercially available for consumer use. As NTEP trials age to the later years (3rd to 5th years) more experimental entries are released as commercial. In any NTEP progress or final report, all entries are identified as either experimental or commercially available. Also, all entries (experimental numbers and commercial names) along with their company sponsors are included.
The all-important statistics are shown at the bottom of each NTEP table (LSDs and CVs, color coded as yellow) in Table 1. Two entries, which are commercially available (Limerick and Arrow, color coded as green), provide acceptable TQ in Massachusetts (MA1) and Maine (ME1). However, according to the LSD value, “Arrow” (TQ=6.9) is statistically better than “Limerick” (TQ=6.2) according to the LSD value (=0.5) for Massachusetts and therefore, “Arrow” should be selected over “Limerick.” Conversely, in Maine both entries have the same TQ ratings as observed in Massachusetts, however, both cultivars perform statistically similar according to the LSD value observed for Maine (=1.0). Either or both cultivars could be selected for Maine and would provide statistically similar TQ. Note that the experimental “B5-45” is statistically the best in Maine (TQ=7.5), however, this entry is not commercially available.
The Ohio location (OH1) is an interesting location from a statistical perspective. This location (OH1) exhibits a CV and LSD that is 2 to 3 times larger compared to the Maine (ME1) and Massachusetts (MA1) locations, respectively. The Ohio location has more noise (see Figure 3, i.e., larger CV and LSD). As such, it is difficult to detect any statistical differences in TQ for this location (Table 1). This location should be avoided and other nearby locations with similar climatic conditions should be used (i.e., MA1). If no nearby NTEP locations exist, then base TQ selection on column means that are averages across all locations (color coded as blue).
Data Other Than Turf Quality
Turf quality is the priority when selecting cultivars. Identifying an NTEP location with similar climatic and cultural conditions to your planting site is also important. To that end, location (site) description information such as soil type, soil pH, mowing height, irrigation levels, shade levels (vs. full sun), simulated traffic, and fertilizer schedules are included in all NTEP reports. Overall, TQ is an average of many turf forming properties including disease and insect damage. Therefore, selecting cultivars that are statistically proven as top performers based on TQ (yearly and monthly TQ) is very important. Selecting 3 to 5 commercially available cultivars that rank in the statistical top for TQ is recommended. Some commercial cultivars may be difficult to purchase because of limited availability, therefore, the more cultivars selected from the top statistical group, the better.
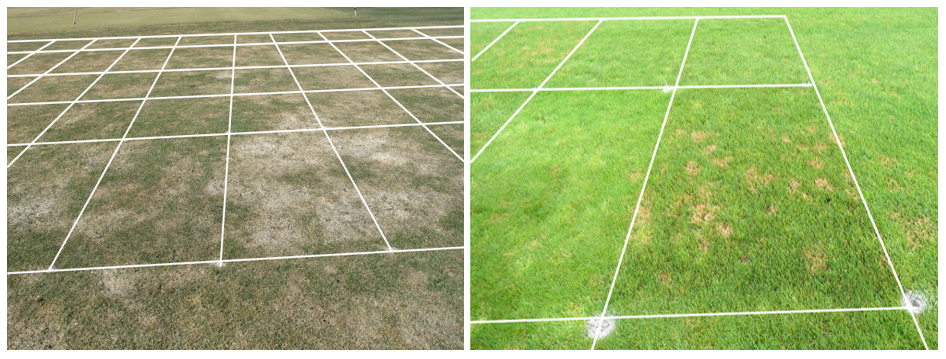
Statistically, TQ data is generally more reliable than other data such as disease or insect damage. Diseases and insects are not distributed uniformly across turf plots (see Photo 5 below); disease and insect data are generally more “noisy.” Close inspection of LSDs and CVs for disease or insect ratings confirm their greater variability indicated by their larger CVs and LSDs compared to TQ.
Photo 5. Disease distribution on perennial ryegrass NTEP plots (Typhula blight, gray snow mold, left) and red thread (right) on NTEP fine fescue turf plots. The non-uniform distribution of diseases across turf plots (cultivars) increase variability and make decisions on disease data less reliable.
Table 2 shows dollar spot ratings (1 to 9, 9=no disease) from a creeping bentgrass NTEP test. Unlike guidelines used for TQ, it is recommended to use all available data with disease or insect ratings. Therefore, averaging across as many locations and years is recommended when selecting cultivars for disease resistance. In Table 2, dollar spot ratings averaged across all locations and years is preferred (color coded as blue). Note the larger CVs and LSDs for dollar spot data (Table 2) compared to TQ (Table 1). Also, note the very large CV and LSD values for the Missouri (MO1) NTEP test location (color coded as green). If this were the only data available for dollar spot, no reliable recommendation is possible because no statistical difference exists in dollar spot ratings due to the large LSD value (=2.5) and large CV (=46.7%) for this NTEP test site. There are no hard rules for the CV, however, for field data a CV less than 15% is reasonable.
Table 2. Dollar spot ratings (1 to 9, 9=no disease) taken on 20 creeping bentgrass entries. These ratings are five (5) year averages taken from the final NTEP report. Only Indiana (IN1), Missouri (MO1) and New Jersey (NJ1) NTEP locations are shown. Top and bottom performers are shown.
The Selection Process
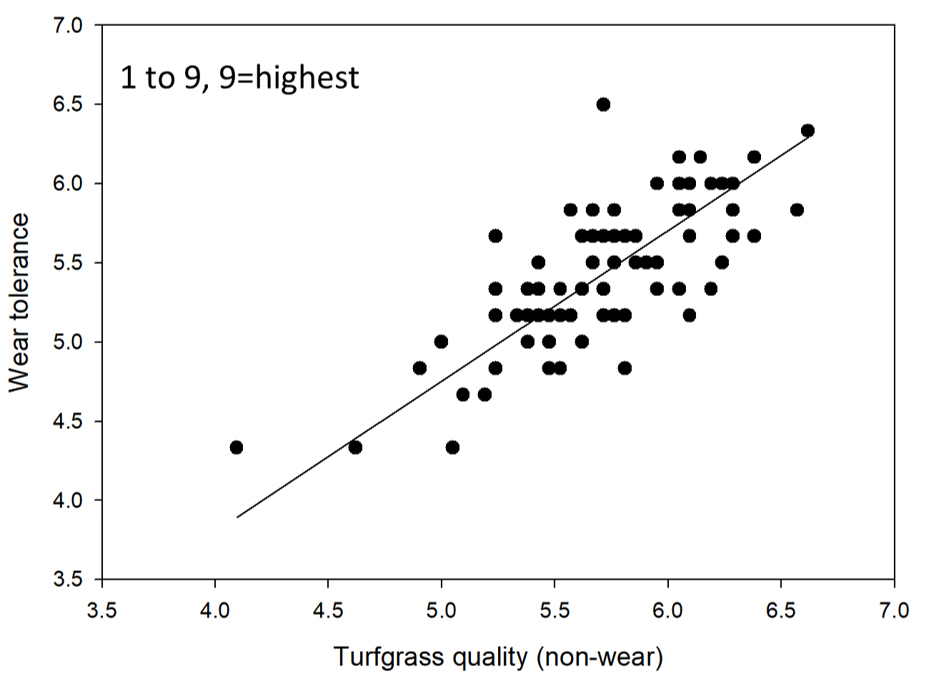
Initial selection of 3 to 5 commercially available cultivars representing the top statistical group of cultivars using TQ and LSDs is the best approach. Generally, the top statistical performers based on TQ exhibit better disease resistance, improved turf forming traits, aesthetic traits such as genetic color, uniformity, density, and performance traits such as drought or traffic tolerance (see Figure 4). These “secondary traits” should not be the primary basis of initial selection of cultivars, but rather used to select for other traits of interest to consumers from within the top statistical TQ group of cultivars. Secondary traits such as color (blending for uniform color), leaf texture (blending for uniform leaf width), density (for traffic tolerance or mowing tolerance or weed ingress), or early spring green-up (monthly TQ) are helpful for refining the roster of top performing cultivars (see Table 3).
Figure 4. Generally, as TQ increases other desirable traits that relate directly to the cultivars’ turf forming properties will also increase (i.e., higher density and wear tolerance). Better TQ in perennial ryegrass was associated with greater wear (traffic) tolerance.
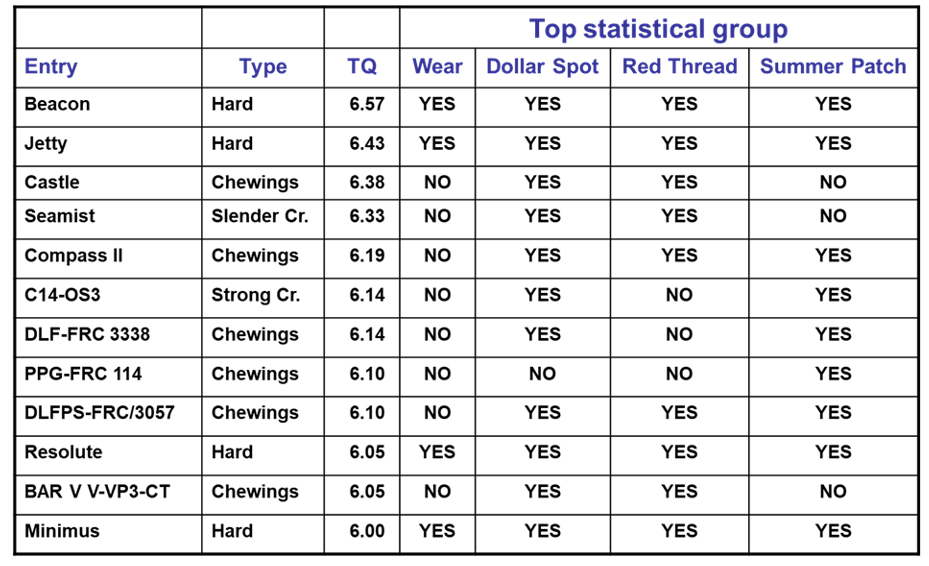
Table 3 is a summary of fine leaf fescue cultivars that are ranked highest to lowest from the last year of an NTEP test site in Massachusetts. There were 43 entries in total including nineteen (19) creeping red fescue, ten (10) Chewings fescue, thirteen (13) hard fescue, and one (1) sheep fescue. The twelve entries in Table 3 include five (5) experimental and seven (7) commercially available entries that are in the top statistical TQ group of cultivars (TQ>6). Also listed in Table 3 are various secondary traits, such as disease and wear (traffic) tolerances that were observed over the previous five years of the test. Secondary traits are categorized in the table as either a ‘Yes’ or ‘No’, indicating performance of entries in the top statistical group.
Table 3 demonstrates that many of the top statistical TQ performers are also in the top statistical group for many secondary traits. Many of the entries are not wear (traffic) tolerant but many entries are in the top statistical group for disease resistance. This type of table informs consumers of specific cultivar trait performance within the top statistical TQ group of cultivars. Many other secondary traits can also be included in such a table depending on the turf forming properties that are available in NTEP progress reports or final reports.
Unlike TQ data, when evaluating any secondary traits (color, density, leaf texture, disease, drought resistance, wear/traffic tolerance, mowing quality and many others) it is recommended to use NTEP data averaged across many locations and years. Secondary trait data is generally less reliable than TQ (i.e., higher CV and LSD) and as such, use of final reports is best.
Table 3. Summary of fine fescue entries for turf quality along with various secondary traits from a completed NTEP test. Only entries from the top TQ statistical group are included (minimum acceptable TQ >6). Secondary traits for an entry are categorized as “Yes” or “No” if an entry is in the top statistical group for that trait.
Table 3 includes both experimental and commercially available entries. Although experimental cultivars are not commercially available for consumer use, it is useful to take notice of which experimental entries are top performers as they may be commercialized in the near future. In the early years of many NTEP trials, top performers are often new or experimental entries. This shows that turfgrass breeders are making significant improvements and progress in turf-forming traits from test-to-test.
Recent Developments in NTEP Data Analysis for Greater Accuracy
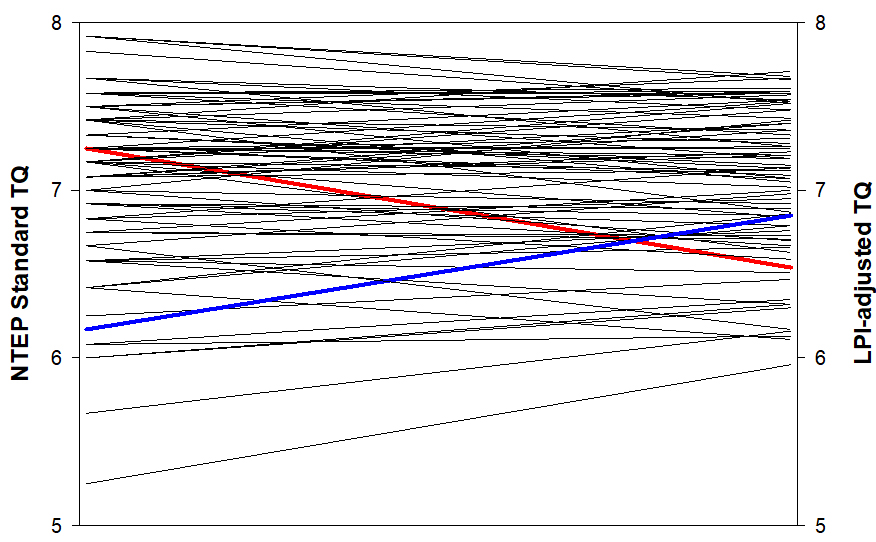
NTEP will group TQ data into statistically similar locations called LPI (Location Performance Index). The number of locations in any one LPI group will vary from one location to several locations. The TQ means in these LPI groups are different from other means for the same entry and location reported elsewhere in NTEP progress and final reports (see Figure 5). The means are different because statistical noise has been removed (see Figure 3) and therefore cultivar means have been adjusted. These adjusted means are statistically 2 to 5 times more accurate than other means reported in NTEP progress and final reports. These LPI adjusted means are the preferred (most accurate) TQ means.
The various NTEP locations within the same LPI group of cultivars can be averaged across all the locations within the same LPI group because all cultivars for all locations have the same approximate TQ rank from top to bottom. This is because statistical noise has been removed! Other averages of cultivars across locations reported for TQ in progress or final reports (Table 1) do not perform consistently from location-to-location and therefore averaging across locations is not recommended.
Figure 5. Comparison of NTEP standard means for TQ (1 to 9, 9=highest) from the 1990 NTEP perennial ryegrass test showing TQ for 123 cultivars and how they rank (left axis). The right axis is the statistically more accurate TQ means adjusted after noise is removed using the LPI analysis (Location Performance Index) and their TQ rank. LPI adjusted means (right axis) are 2 to 5 times more accurate because statistical noise has been removed using a more effective statistical method of data analysis, which was recently adopted by NTEP. The cultivar represented by the red line shows a loss in TQ after noise is removed while the cultivar indicated by the blue line shows a gain in TQ after statistical noise is removed.
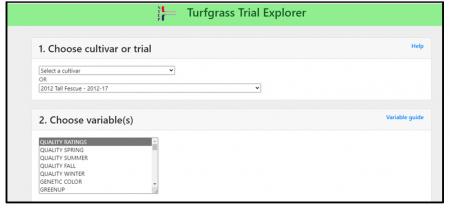
NTEP Turfgrass Trial Explorer v1.0 (https://maps.umn.edu/ntep/)
Turfgrass Trial Explorer is a new search tool that is linked to 40+ years of data collected by NTEP and its university cooperators. The tool allows any consumer/user to quickly access and locate TQ information as well as secondary traits needed to make decisions on turfgrass cultivars and experimental selections. It is very user friendly and free! Consumers (professional and residential) are encouraged to use this new search tool, however, the basic guidelines discussed here should be followed to ensure reliable cultivar selections.
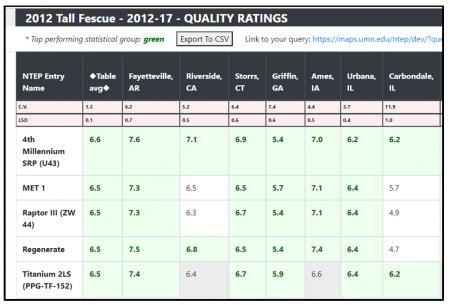
Below is a screen shot of the NTEP Turfgrass Trial Explorer showing the menu for selcting individual cultivars or tests and data variable. In this example the 2012 Tall Fescue test was selcted and the data variable selected for this example was turf quality.
Below is the screen shot for the data output for the menu above ordered from highest to lowest in TQ. Only some of the locations and entries for the 2012 test are included below. The original 2012 NTEP test for tall fescue included 28 locations and 116 entries submitting data. LSDs and CVs are included. Overall averages (i.e., Table avg) along with location (evaluation site) averages for TQ are included. Note that the rank order can be changed for each column of TQ data. The green highlighted TQ values indicate entries in the top statistical group.
Selection Steps in Summary
- Know the stresses active at your planting site that are the cause of the deterioration and decline in turfgrass quality (TQ). These stresses (traits) form the criteria for selecting adapted species and cultivars.
- NTEP is the most reliable source of information for cultivar selection. NTEP cooperators are experienced university investigators trained in the rating of turf cultivars for TQ (1 to 9, 9=best).
- NTEP data is replicated over many years and across numerous test locations in scientifically replicated plots – NTEP results are statistically proven.
- Statistics matter – pay close attention to LSDs and CVs in reviewing NTEP data which form the scientific basis for selecting the statistically top (best TQ) cultivars.
- TQ ratings are the priority –statistically more reliable and should be the basis for initial cultivar selection. TQ ratings are an average of the aesthetic components and functional aspects of the turf.
- Secondary traits are the basis for refining initial cultivar selections based on TQ (see Steps 4 and 5) – there may be up to 50 turf-forming traits reported by NTEP such as turf density, genetic color, leaf texture ratings or disease, insect, and drought tolerance that may correspond closely to your selection criteria at your planting site (see Step 1).
- Pay close attention to NTEP test location (site) descriptions – some NTEP test sites evaluate drought, traffic, or shade while other locations may share similar climatic and cultural (maintenance) conditions to your planting site.
- Access to NTEP data is free, so visit (https://ntep.org/information.htm)
- Newly released NTEP Turfgrass Trial Explorer v1.0 (https://maps.umn.edu/ntep/) makes turf selection easier.

