In the Northeastern United States, high populations of nematodes in turf areas are generally restricted to golf greens as opposed to golf fairways, athletic fields, and lawn areas. Golf greens provide an ideal environment for nematodes. Root zones are commonly 75% to 95% sand which provides ideal pore spaces for oxygen, water and nematode mobility, and greens are watered frequently. Plant parasitic nematodes are found in all soils where plants grow but damage does not occur unless high populations develop. Golf greens can support high nematode populations and damage is exacerbated by other stresses brought about by environmental conditions, cultural practices and play.
Nematodes injure turfgrass roots either by feeding or burrowing through tissues. Depending on the host and the nematode involved, symptoms on roots include: inhibition of root elongation, swollen tips, galls, lesions, and shortened stubby roots. In most cases root symptoms are not obvious. Symptoms occurring above-ground result from root dysfunction and are not unique to nematodes. Patchy areas of wilting, thinning and decline occur where nematode populations are excessively high. Lance nematodes can result in patches of dead grass similar to fungal patch diseases. Above-ground symptoms are of little value in diagnosing nematode problems in turf. An accurate assessment of the pathogenic potential of nematodes can only be determined by a nematode assay.
Extraction of nematodes from soil is an imperfect process and only provides an estimation of the total population. Repeated extractions from the same soil sample will yield different results. It is not important exactly how many nematodes are recovered from the soil. Populations above thresholds are potentially a problem, while low populations are not. Moderate to high populations of nematodes should be considered within the context of other stresses and diseases present at the time.
Nematode population distribution
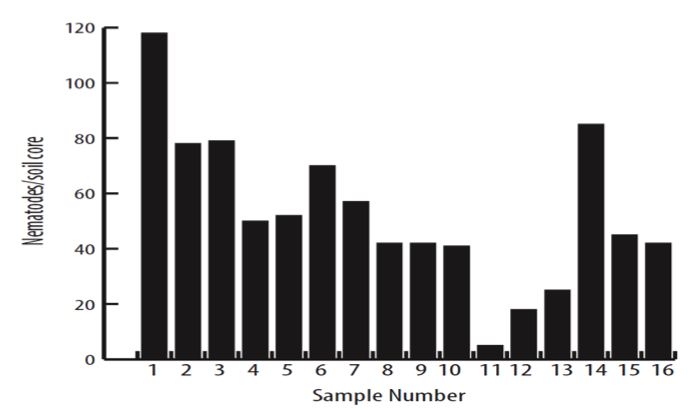
Nematodes are unequally distributed in the soil both vertically and horizontally. In the horizontal plane, nematodes have a clumped distribution. Figure 3 shows the number of nematodes in individual soil cores taken at one foot intervals in a transect across a putting green. The average number of nematodes in the example is 51. With regard to vertical distribution, population densities of various species differ according to the depth at which the sample was taken. Some tend to be concentrated in the upper portion of the soil profile. For example, a sample taken at a 2” depth may have twice the concentration of stunt nematodes as the same sample taken at 4”. Other nematodes may be more evenly distributed through the 4” depth.
Time of year
During winter months nematode populations decline. As the turf resumes growth, nematodes begin feeding. The reproductive potential of nematodes increases as the soil temperature rises. In Massachusetts, populations peak anytime from mid-June through mid- to late July. An additional peak of activity may occur later in the season.
| For More Information |
|---|
| For further information about turf nematode assays and assay fees, refer to the UMass Extension Plant Diagnostic Lab at ag.umass.edu/services/plant-diagnostics-laboratory. |
Assay procedure
It is not possible to extract all of the nematodes from a soil sample. Also, extraction techniques vary from one laboratory to another and some techniques are more efficient than others for recovering certain species.
Collecting a soil sample
Nematode populations are estimated most accurately with a composite sample. Use a 3/4” to 1” diameter soil probe, or something similar, and sample to a depth of 3 to 4” throughout the site. If a patch of dead turf is present, take 6 or 7 cores from within the patch, and for comparison, take 8 to 10 cores in a circle about 1 foot from the damage.
When damage is evident, collect 20 to 25 subsamples from throughout the affected area and bulk them. For comparison, a composite sample should also be taken from an adjacent, healthy appearing area.
When no damage is evident the entire green can be sampled by collecting 15 to 20 samples and bulking them as one. However, if the same green is sampled again, the assay results may be different solely because of the unequal distribution of nematodes. Also, there may be “hot spots” were nematode populations are high. When the intention is to monitor nematode populations over the course of the year, or from season to season, choose an area no larger than 500 sq. ft. Return to the same area later for additional samples. Collect 15 to 20 cores from within the designated area and bulk them.
The soil (at least one-half pint) should be placed in a container, such as a plastic bag, to prevent desiccation. Clearly identify the sample number on the outside of the container. After collection, refrigerate or deliver to The UMass Extension Plant Diagnostic Lab as soon as possible (ag.umass.edu/services/plant-diagnostics-laboratory).
Figure 3. Horizontal distribution of nematodes in a sample putting green
Golf greens provide an ideal environment for nematodes. Root zones are commonly 75% to 95% sand which provides ideal pore spaces for oxygen, water and nematode mobility.
Important note
Due to fluctuations in population levels over the course of the season, a single-sample evaluation for nematodes can be misleading, particularly if the results indicate populations below “threshold levels.” A more comprehensive evaluation the following year is recommended as a follow-up. Collect samples as outlined above starting in early June and re-sampling every four to five weeks until mid- to late September.