Numbers Slightly Decline in 2017
Massachusetts Agricultural Census 2017
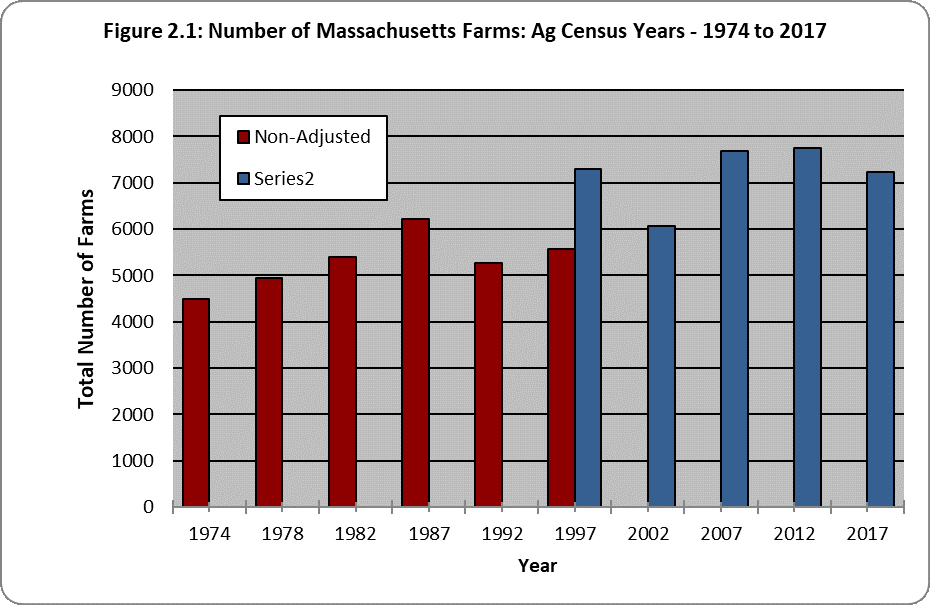
In general, throughout the 1970s and 1980s, farm numbers in Massachusetts increased as measured by the Census of Agriculture. Under the old methods of counting farms, Massachusetts’s farm numbers peaked in the late 80s, declined in 1992, then rebounded slightly in 1997.
The 1997 Census of Agriculture reported 5,574 farms in Massachusetts. For the 2002 Census, procedural changes were made to ensure more complete coverage of farms. For comparisons, the 1997 Census figures were adjusted. The adjusted census data showed there were 7,307 farms in Massachusetts in 1997. In 2002, the number of farms decreased 17 percent to 6,075 farms. The 2007 Census reported an increase in the number of farms to 7,691, which is equivalent to a 26 percent increase as compared to 2002. The 2012 Census reported a much more modest increase in the number of farms in Massachusetts to 7,755. In 2017, farm numbers once again decreased about 6.6 percent to 7,214 farms.

The table below shows the number of farms and total land in farms (Acres-Land in Farms) for census years from 1974 to 2017. Until 2017, the number of farms showed a general increasing trend, with a decline in 1992, a large increase in 1997 (after coverage adjustments), followed by a decline in 2002 and subsequent rise between 2007 and 2012. The number of farms during the period 1974-2017 increased by about 61 percent, while the total land in farms in 2017 is about 82 percent of that in 1974. The total land in farms in 2017 decreased to 491,653 acres from 517,879 acres in 1974, a decline of about 18 percent in acreage.
| Year | Number of Farms | Total Land in Farms |
|---|---|---|
| 1974 | 44,497 | 601,734 |
| 1978 | 4,946 | 617,359 |
| 1982 | 5,401 | 612,819 |
| 1987 | 6,216 | 615,185 |
| 1992 | 5,258 | 526,440 |
| 1997 | 5,574 | 518,299 |
| 1997 Adjusted | 7,307 | 577,637 |
| 2002 | 6,075 | 518,570 |
| 2007 | 7,691 | 517,879 |
| 2012 | 7,755 | 523,517 |
| 2017 | 7,241 | 491,653 |
