Input Price Indices
Massachusetts Agricultural Census 2017
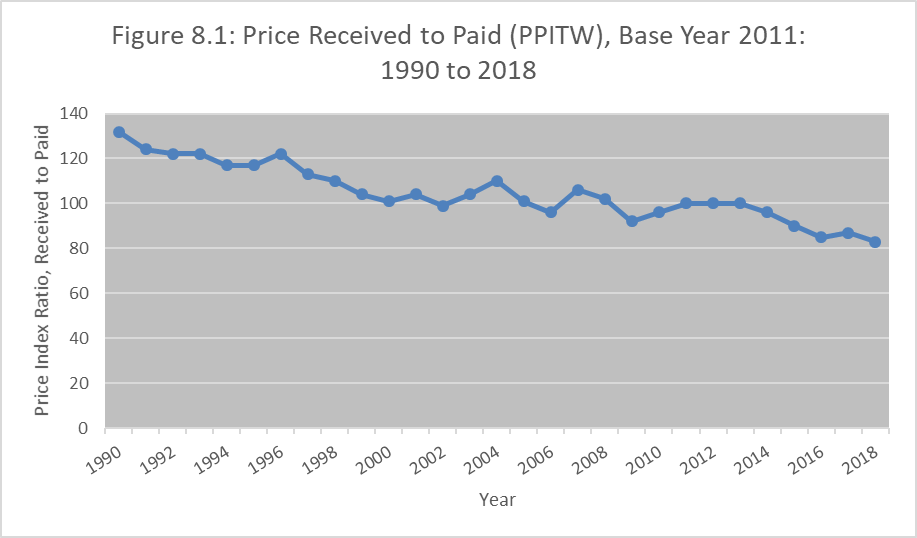
Figure 8.1 shows the Price Index Ratio, which reflects prices received for all farm products and the prices paid for all farm inputs from 1990 to 2018, with base year 2011. The index shows that over the last three decades, the price received by farmers selling products has steadily declined in relation to the price paid for inputs. For farmers to continue to operate, cost saving technologies need to be adopted to improve productivity allowing farmer to produce more using fewer or less expensive inputs.