Operators/Producers by County
Massachusetts Agricultural Census 2017
In 2017, the Agricultural Census changed the way it counts the people who run a farm. Due to the change, it is difficult to disentangle whether changes in operator/ producer primary occupation and time on/off reported in 2017 represent fundamental changes since 2012, or simply reflect changes in the way the question was asked.
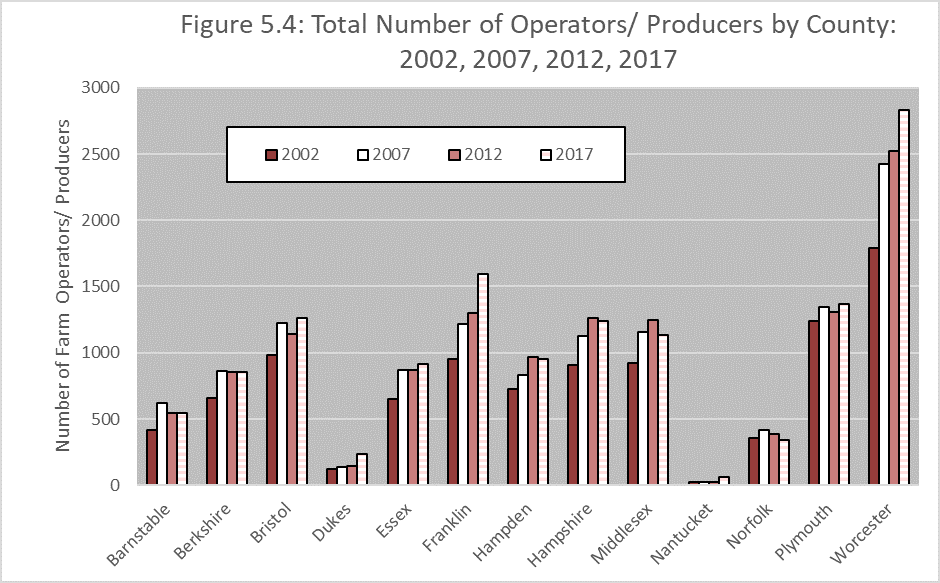
The number of Massachusetts farm operators increased in all counties between 2002 and 2007 (Figure 5.4). During that period, the number of Massachusetts farm operators increased by 2,500.
Between 2007 and 2012, the number of farm operators in Massachusetts increased by a modest 302 operators, and both modest increases and decreases were found in the counties across the Commonwealth. The number of farm operators increased between 2007 and 2012 for Dukes, Franklin, Hampden, Hampshire, Middlesex, and Worcester Counties, but declined in Barnstable, Berkshire, Bristol, Essex, Nantucket, Norfolk, and Plymouth Counties. Most increases in farm operators occurred in the central part of the state. Franklin, Hampden, Hampshire, Middlesex, and Worcester Counties saw increases of 87 (Franklin) to 137 (Hampden) farm operators in 2012. The greatest declines in 2012 were in Barnstable (79) and Bristol (81) Counties. It’s important to remember that these changes do not reflect changes in farm numbers. These were changes in all farm operators, principal and other farm operators; some farms simply had fewer operators.
In 2017, the number of primary producers estimated for each county generally increased, although we do not know whether to increase this change to the new methodology or actual increases in primary producers. The increases over 2012 farm operators ranged from 0.7 percent in Berkshire County to 158.3 percent in Nantucket County. The Nantucket County change likely reflects a change in census methodlogy, as opposed to an increase in actual numbers of producers.
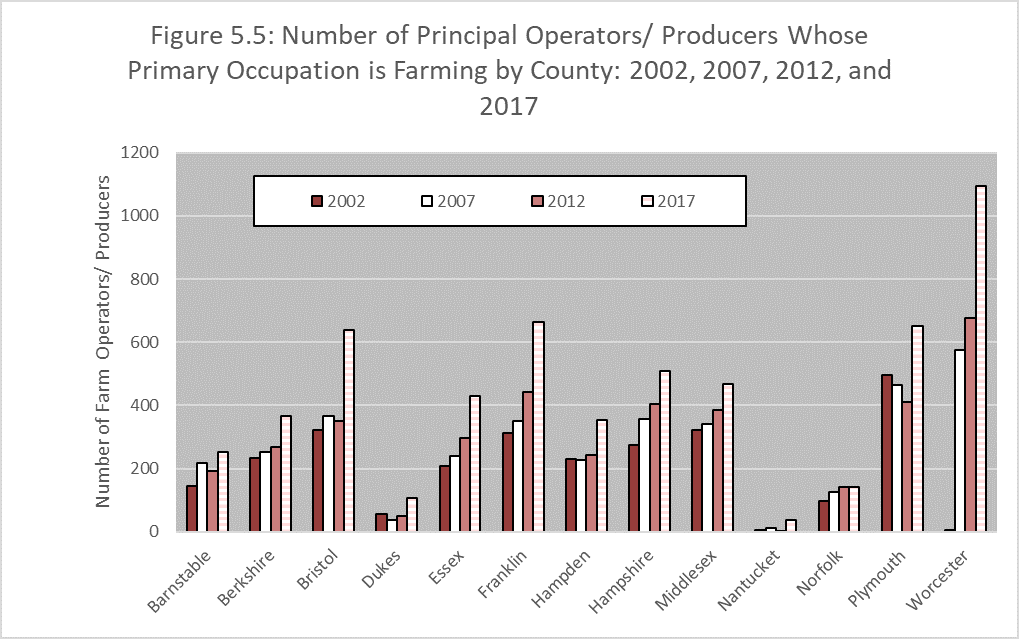
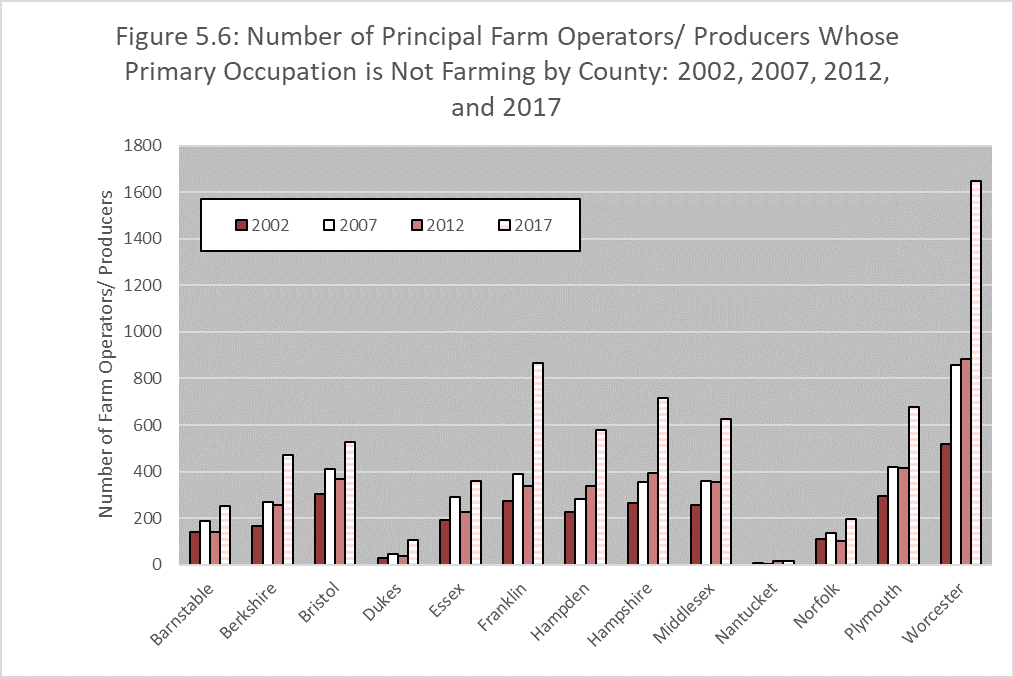
In Figures 5.5 and 5.6 we consider changes that occurred in the numbers of principal farm operators/ producers by county. The number of principal farm operators for whom farming was their primary occupation increased from 2007 to 2012 in Massachusetts by nearly 300 operators. Only four counties (Barnstable, Bristol, Nantucket, and Plymouth) saw declines in the number of principal farm operators who considered farming their primary occupation in 2012. The numbers of principal farm operators who did not consider farming their primary occupation declined in all but four counties (Hampden, Hampshire, Nantucket, and Worcester in 2012. In some counties, farmers who considered farming as their primary occupation may have made the change to a greater reliance on off-farm income. For some counties, Barnstable, Bristol, and Plymouth, we can conclude that there was a net exit from farming for both full and part-time farmers.
The story behind the changes in numbers of primary farm operators between 2007 and 2012 was much different than the changes that occurred between 2002 and 2007. In 2007, the number of farm operators who did not consider farming their primary occupation increased from the 2002 levels, while the number of operators who considered farming their primary occupation declined. Thus, most of the increases in principal farm operators was for part-time farmers between 2002 and 2007 – those who considered their primary occupation to be something other than farming. Between 2007 and 2012, we find the opposite. There was been an increase in the number of farmers who consider farming their primary occupation, while the number of operators who do not consider farming their primary occupation has declined. A number of farmers may have made the transition from part-time to full-time, and some part-time farmers may have left farming.
In 2017, this could be a similar story, or it could be that the increase reflects operations with more that one producer whose primary occupation is farming, and these additional producers are now counted. Future census years will allow a more nuanced interpretation of the increases reported in 2017.