Diverse Mix of Farm Types
Massachusetts Agricultural Census 2017
What are the predominant types of farms in Massachusetts? Massachusetts consists of a very diverse group of farms. If we rank farm types by the numbers of farms, the most predominant type of farm in 2017 was hay farming, accounting for 1,001 farms, or about 14 percent of all Massachusetts farms in 2017 (Figure 2.1). Close behind are the farms involved in vegetable and melon farming, accounting for 908 farms, or about 13 percent of all Massachusetts farms in 2017. Horse and other equine farming followed, accountnig for 892 farms, or about 12 percent of all Massachusetts farms in 2017. Fruit, tree nut and berry farming, which includes the Commonwealth’s cranberry growers and orchards, accounted for 845 farms, or about 11.7 percent of total Massachusetts farms. Greenhouse, nursery and floriculture accounted for 777 farms, or about 10.7 percent of total Massachusetts farms.
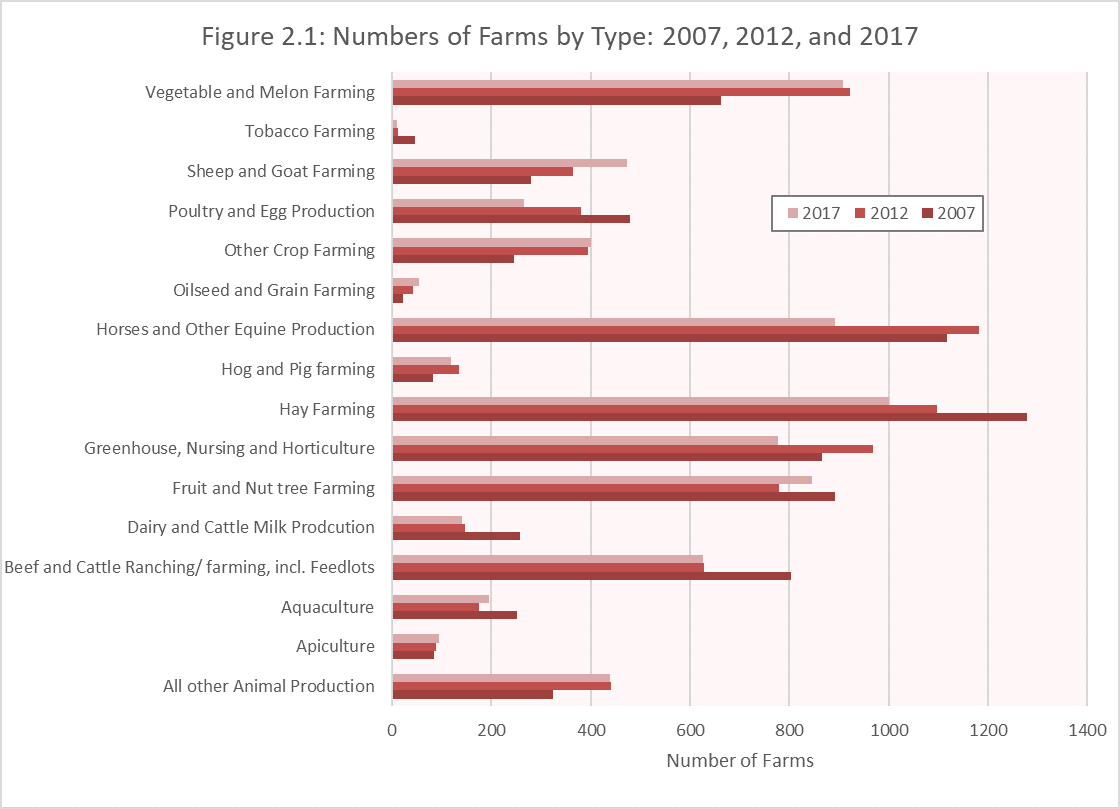
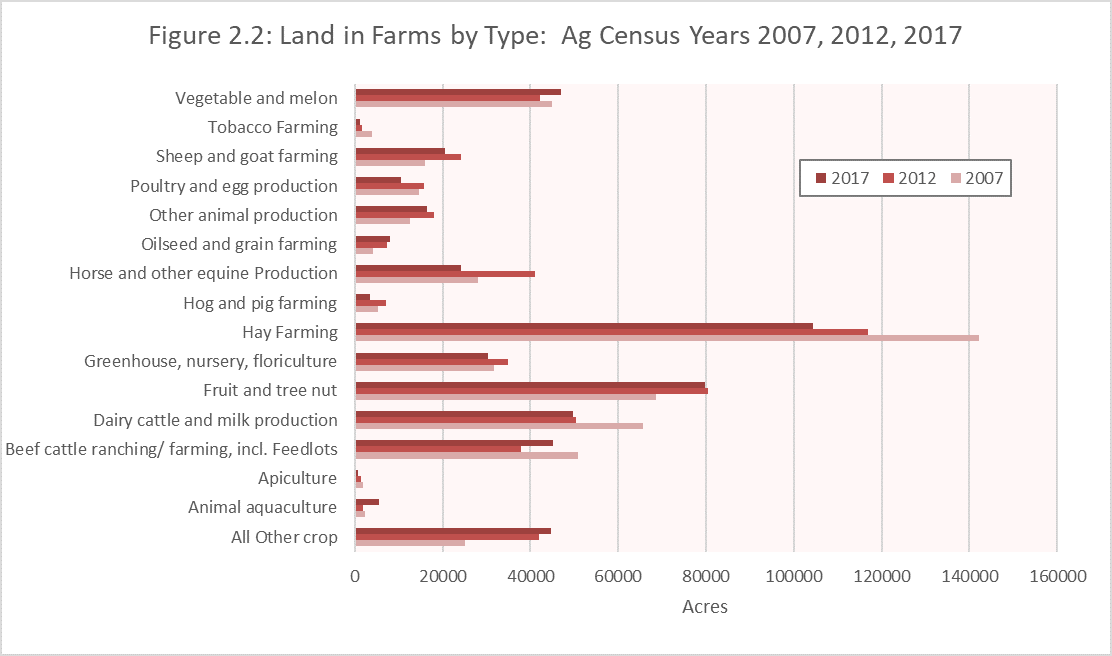
Figure 2.2 and the tables below summarize the total land in farms by type for the years 2007, 2012, and 2017. Hay farming was at number one in 2007 and 2012 in terms of the total land in acres utilized and continued at number one in 2017 with over 104,000 acres of land in hay. Hay farming accounted for 21 percent of the total Massachusetts land in farms. In 2017, hay farming declined in acreage by over 10 percent from 2012. While the number of fruit, tree nut and berry farming increased by about 8 percent between 2012 and 2017, the amount of land used for fruit, tree nut and berry farming decreased by about 1 percent. In 2017 fruit, tree nut and berry farming represented 16 percent of the total land in farms with slightly under 80,000 acres of Massachusetts’s farmland. Dairy cattle and milk production, which was ranked third in 2007 and 2012, continues to hold the third spot, but the number of acres has fallen about 1 percent to just under 50,000 acres. Land in dairy farms fell from nearly 18 percent of the Commonwealth’s farmland in 2002, to around 13 percent in 2007, and less than 10 percent in 2012, where it has held steady in 2017. Vegetable and melon farming and beef cattle ranching and farming were ranked fourth and fifth, respectively, in 2017. Interestingly, horse and other equine farms, which neared the top five with nearly 41,000 acres of farmland in 2012, decreased 70 percent from the 2012 acreage.
| Commodity | Acres | Percent of Total | Farms | Acres Per Farm |
|---|---|---|---|---|
| Oilseed and grain farming | 4,253 | 0.8% | 22 | 193.3 |
| Vegetable and melon | 44,974 | 8.7% | 662 | 67.9 |
| Fruit and tree nut | 68,566 | 13.2% | 893 | 76.8 |
| Greenhouse, nursery, floriculture | 31,705 | 6.1% | 865 | 36.7 |
| Tobacco farming | 3,914 | 0.8% | 46 | 85.1 |
| Hay | 142,168 | 27.5% | 1278 | 111.2 |
| Other crop | 25,018 | 4.8% | 246 | 101.7 |
| Beef cattle ranching and farming | 50,890 | 9.8% | 804 | 63.3 |
| Dairy cattle and milk production | 65,645 | 12.7% | 258 | 254.4 |
| Hog and pig farming | 5,199 | 1.0% | 82 | 63.4 |
| Poultry and egg production | 14,677 | 2.8% | 480 | 30.6 |
| Sheep and goat farming | 15,100 | 3.1% | 279 | 57.7 |
| Animal aquaculture | 2,402 | 0.5% | 252 | 9.5 |
| Apiculture | 1,774 | 0.3% | 84 | 35.9 |
| Horse and other equine production | 27,987 | 5.4% | 1117 | 21.1 |
| Other animal production | 12,607 | 2.4% | 323 | 39.0 |
| Total | 517,879 | 100.00% | 7691 |
| Commodity | Acres | Percent of Total | Farms | Acres Per Farm |
|---|---|---|---|---|
| Oilseed and grain farming | 7,375 | 1.4% | 41 | 179.9 |
| Vegetable and melon | 42,248 | 8.1% | 923 | 45.7 |
| Fruit, tree nuts and berries | 80,568 | 15.4% | 779 | 103.4 |
| Greenhouse, nursery, floriculture | 34,886 | 6.7% | 968 | 36.0 |
| Tobacco farming | 1,672 | 0.3% | 11 | 152.0 |
| Hay | 116,980 | 22.3% | 1097 | 106.6 |
| Other crop | 42,024 | 8.0% | 394 | 106.7 |
| Beef cattle ranching and farming | 37,967 | 7.3% | 628 | 60.5 |
| Dairy cattle and milk production | 50,367 | 9.6% | 147 | 342.6 |
| Hog and pig farming | 7,128 | 1.4% | 135 | 52.8 |
| Poultry and egg production | 15,851 | 3.0% | 380 | 41.7 |
| Sheep and goat farming | 24,278 | 4.6% | 365 | 66.5 |
| Animal aquaculture | 1,809 | 0.3% | 175 | 10.3 |
| Apiculture | 1,508 | 0.3% | 89 | 16.9 |
| Horse and other equine production | 40,968 | 7.8% | 1183 | 34.6 |
| Other animal production | 17,988 | 3.4% | 440 | 40.9 |
| Total | 523,517 | 100.00% | 7755 |
| Commodity | Acres | Percent of Total | Farms | Acres Per Farm |
|---|---|---|---|---|
| Oilseed and grain farming | 7,990 | 1.63% | 55 | 145.3 |
| Vegetable and melon | 47,082 | 9.58% | 908 | 51.9 |
| Fruit, tree nuts and berries | 79,697 | 16.21% | 845 | 94.3 |
| Greenhouse, nursery, floriculture | 30,301 | 6.16% | 777 | 39.0 |
| Tobacco farming | 1,152 | 0.23% | 9 | 128.0 |
| Hay | 104,304 | 21.21% | 1001 | 104.2 |
| Other crop | 44,625 | 9.08% | 401 | 111.3 |
| Beef cattle ranching and farming | 45,200 | 9.19% | 626 | 72.2 |
| Dairy cattle and milk production | 49,744 | 10.12% | 140 | 355.3 |
| Hog and pig farming | 3,473 | 0.71% | 119 | 29.2 |
| Poultry and egg production | 10,643 | 2.16% | 265 | 40.1 |
| Sheep and goat farming | 20,629 | 4.20% | 474 | 43.5 |
| Animal aquaculture | 5,508 | 1.12% | 195 | 28.2 |
| Apiculture | 812 | 0.17% | 95 | 8.5 |
| Horse and other equine production | 24,132 | 4.91% | 892 | 27.1 |
| Other animal production | 16,370 | 3.33% | 439 | 37.3 |
| Total | 491,653 | 100.00% | 7241 |
