Geography of Farms
Massachusetts Agricultural Census 2017
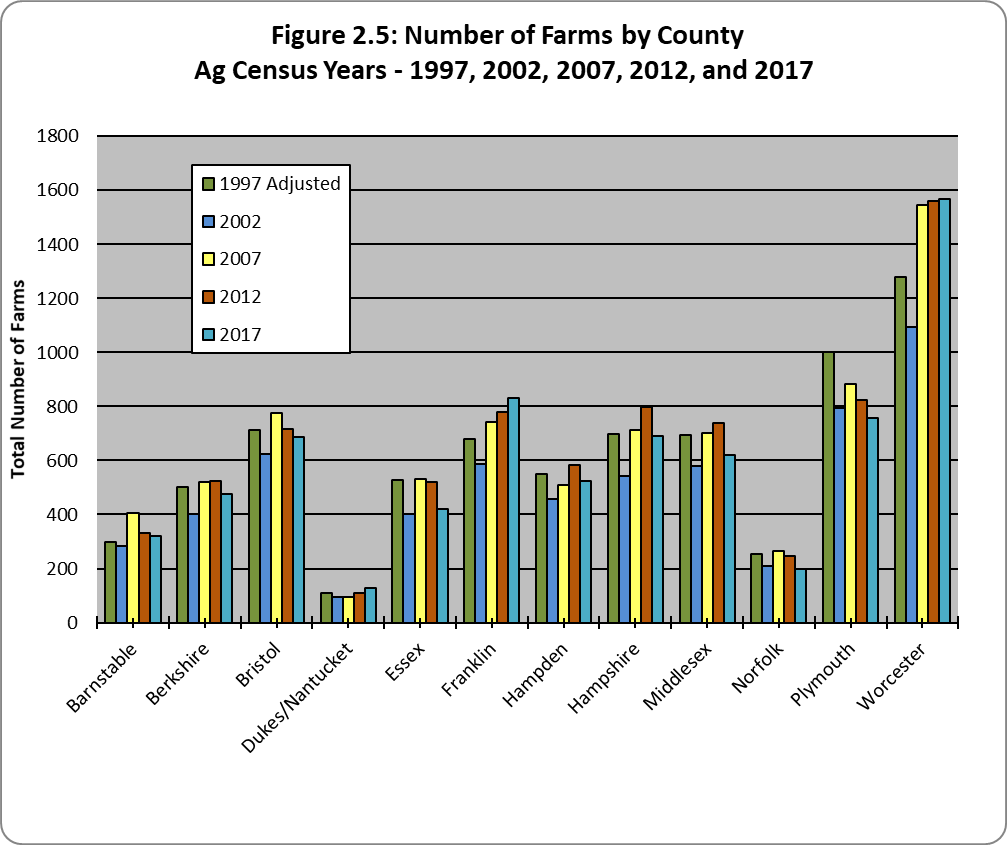
Where are the farms in Massachusetts? While the Commonwealth’s farms are spread across the state, Worcester County held over 21 percent of the total number of farms in 2017. Franklin County held 11.46 percent of the state’s farms while Plymouth (10.47 percent), Hampshire (9.56 percent) and Bristol (9.50 percent) Counties each held about 10 percent of the state’s total. This represents a shift from 2012, when Middlesex (8.56 percent) also held about 10 percent of the state’s total. In the Connecticut River Valley, the three counties of Hampden (7.22 percent), Hampshire (9.56 percent) and Franklin (11.46 percent) accounted for just above 28 percent of all Massachusetts farms.

Farm numbers increased across the Commonwealth and in most Massachusetts counties between 2002 and 2017 (Figure 2.5). Two counties saw declines between 2002 and 2017; the number of farms in Norfolk County declined 5.3 percent and 4.5 percent in Plymouth County. Overall, farm numbers increased 16 percent between 2002 and 2017.
There were increases in farm numbers between 2012 and 2017 in Suffolk (5 percent), Nantucket (5 percent), Dukes (22.7 percent), Franklin (6.4 percent) and Worcester (0.51 percent) Counties. However, there were also declines in farms numbers in Barnstable (3.6 percent), Berkshire (9.52 percent), Bristol (4.04 percent), Essex (19.73 percent), Norfolk (19.59 percent), Middlesex (16.1 percent) and Plymouth (8.12 percent) Counties.
Worcester County continues to lead the state in terms of farm numbers, with 1,568 farms in 2017 up nominally from 1,560 farms in 2012. Franklin County rose to second with 830 farms from 780 farms in 2012. Plymouth County, with 758 farms, is third, falling from 825 farms in 2012. Between 2012 and 2017, Hampshire County lost 107 farms, to rank fourth in the state, a decrease of more than 13.39 percent; although Hampshire County saw an increase of more than 27.7 percent between 2002 and 2017 overall. Bristol County, which was ranked sixth in 2012 with 717 farms, lost 29 farms, but still returned to its 2007 ranking of fifth in the state in numbers of farms. The loss represents a 4.04 percent decrease in the number of farms between 2012 and 2017, but an overall 10.3 percent increase in the number of farms between 2002 and 2017.
These numbers reflect programs in place in Massachusetts to tax farmland at its use-value (Massachusetts General Laws Chapter 61A) and to help preserve farmland [Agriculture Preservation Restriction (APR) Program].