Farm Expenses
Massachusetts Agricultural Census 2017
Between the years 1987 and 2017 there was an increase of 95.9 percent in the total production expenses of farms in Massachusetts, and a 68.2 percent increase in the average production expenses per farm. Between 2002 and 2007 the total farm production expenses increased 26.49 percent, while the average farm production expenses decreased slightly by 0.05 percent. Between 2002 and 2007, farmers spent less per farm, on average, on supplies and other inputs due to the reduced land in their farms. However, between 2007 and 2012, both average farm production expenses and total farm production expenses increased for Massachusetts farmers. Total farm production expenses increased from $461 million in 2007 to $539 million in 2012, while the average farm production expenses increased from $60,000 per farm to $69,545 per farm. Total and average farm production expenses again declined in 2017, likely due to reduced land in farms.
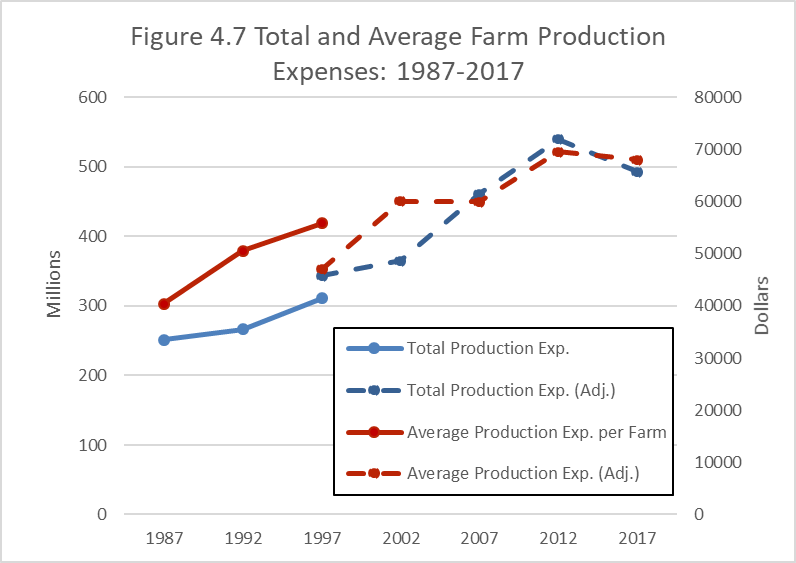
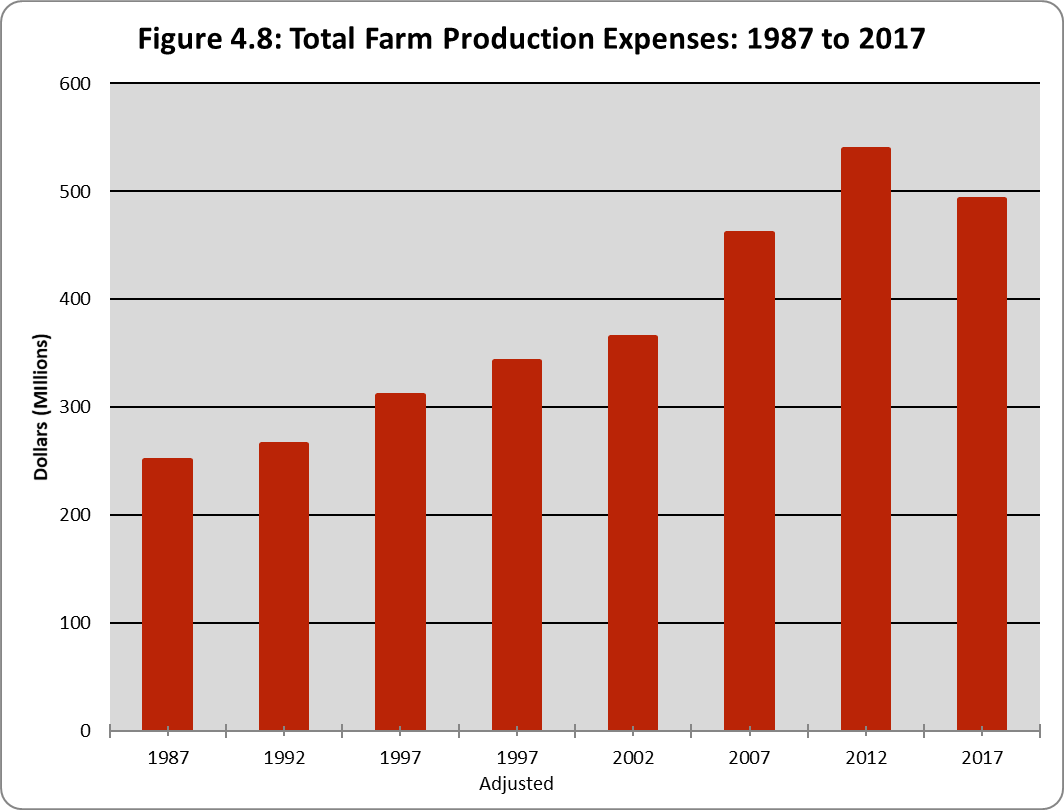
Figure 4.8 illustrates the total amount spent by Massachusetts farmers, a measure of economic activity that stimulates the Massachusetts economy. That economic activity was $492.7 million in 2017, an decrease of nearly 9 percent over the 2012 level of $539.3 million. Total production expenses increased between 1987 and 2012 due to changes in the mix of agricultural products produced, changes in input prices and changes in the number of farms. Figure 4.8 reflects all these changes, as well as decreases in the number of Massachusetts farms in 2017.
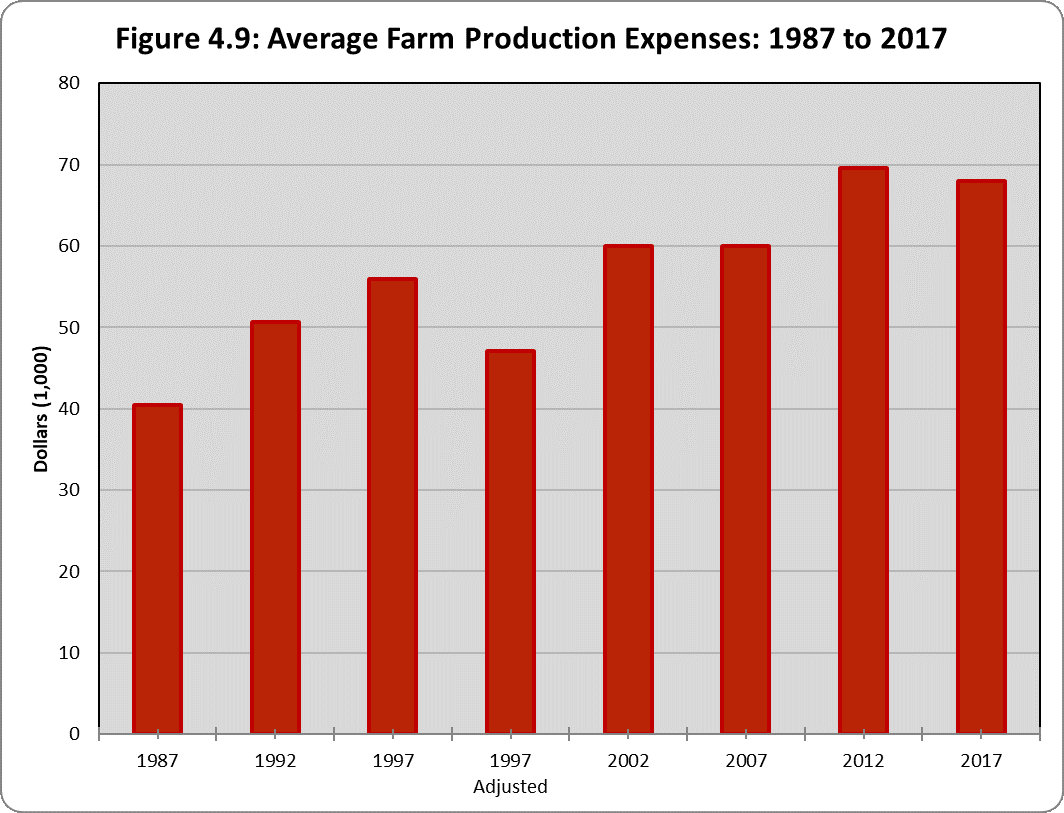
To eliminate one of these factors (changes in the number of Massachusetts farms) we show average farm production expenses in Figure 4.9. The average Massachusetts farm spent $40,460 in 1987. By 2017, that figure had increased by near 68.2 percent to $68,038. While expenses per farm remained stable between 2002 and 2007, the 2012 level represents an increase of nearly 16 percent, and the 2017 level represents a modest decrease of around 2 percent. These increases are due to input price increases, but also reflect changes in the mix of agriculture between the 2007 and 2017 Agricultural Censuses. The size of the farms has decreased in Massachusetts, and if there are economies of size in farming, smaller farms would have higher expenses per farm. But, the mix of agricultural products has also changed and these changes affect expenses per farm. Finally, increases in technological adoption, in particular sales and marketing, may decrease average expenses.
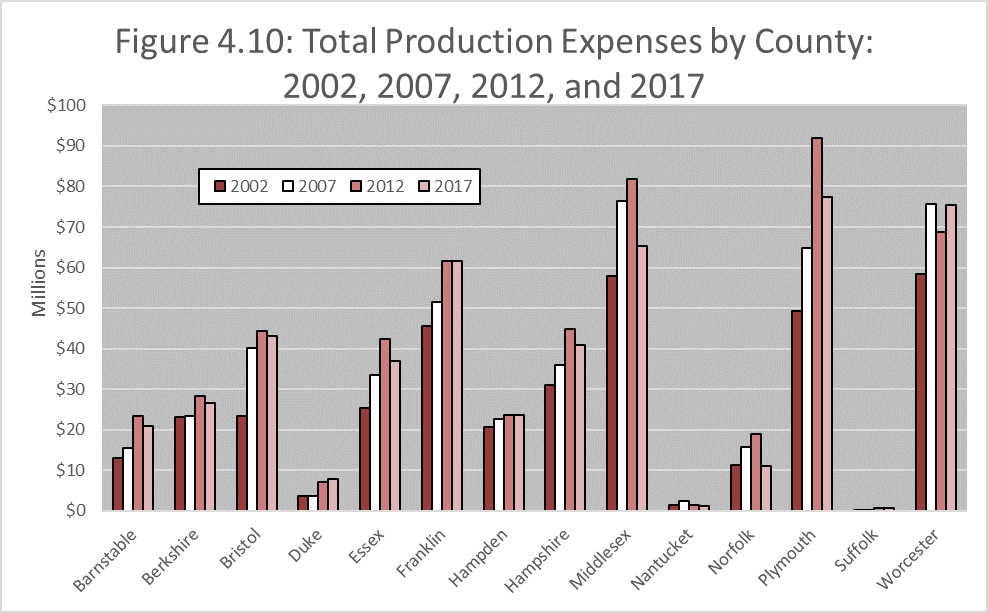
Which counties have the greatest agricultural contributions to the Massachusetts economy? Figure 4.10 shows total production expenses by county for the Census years 2002 – 2017. Plymouth County led the way in 2017 on the strength of its fruits, tree nuts and berries production, primarily cranberries, with nearly $77.3 million in expenses. Middlesex contributed $65.2 million with a majority of those expenditures due to nursery, greenhouse and floriculture production. Other top counties include Worcester ($75,509 million), Franklin ($61.6 million), Hampshire ($40.8 million) and Bristol ($43.1 million), where agriculture is much more diverse.