Market Value Increases
Massachusetts Agricultural Census 2017
Value of Farm Output Has Decreased Slightly
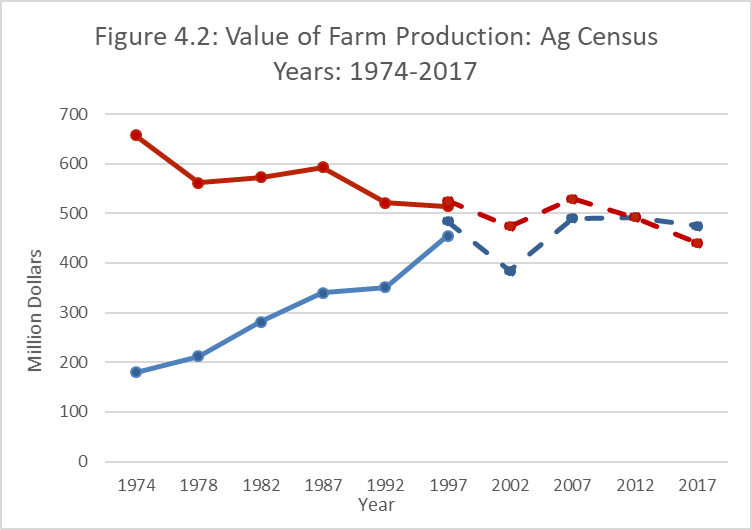
After a consistent upward trend during the prior three decades, the value of agricultural products sold declined between 1997 and 2002, seems to have recovered between 2002 and 2012, but slightly declined in 2017. The market value of agricultural products in Massachusetts increased steadily from $179.7 million in 1974 to $454.4 million in 1997. The most dramatic increase was between 1992 and 1997, when the market value of Massachusetts' agricultural products increased by nearly 30 percent. The 1997 value was subsequently adjusted for coverage upwards to $483.5 million. The adjusted figure is comparable to the 2002 Agricultural Census market value of $384.3 million. Thus, the market value of Massachusetts agricultural products is estimated to have fallen by nearly $100 million (about 20 percent) between 1997 and 2002. During this period, the cranberry industry suffered dramatic price decreases. However, the value of agricultural products increased to $489.8 million between 2002 and 2007, and again to $492.2 billion between 2007 and 2012. After the steep decline observed between the years 1997 and 2002, the market value of agricultural products in Massachusetts increased more than $100 million between the years 2002 and 2012. Between 2012 and 2017, there was a 3.5 percent decrease in market value, to $475.2 billion.
What is coverage adjustment?
The Census of Agriculture measures activities of the farm sector by gathering data from a list of known agricultural operators. The list is compiled from past census records, federal agencies and trade associations. NASS maintains as complete a list as possible. However, it's likely that some farms will not be included in the lists. NASS measures the completeness of the lists by conducting surveys (Area Frame Surveys) where they randomly sample tracts of land. In these sample tracts, every agricultural operation and all agricultural land is counted and compared to the census lists. Adjustments are then made in the totals based on the information obtained from these samples. For example, if the Area Frame Samples suggest that farms are under-counted by the census lists, then upwards adjustments are made in census table data reported. This happened in Massachusetts – the number of farms reported in the 1997 census was 5,574 while the adjusted total was 7,307. (More information on the 2012 Agricultural Census at: http://www.agcensus.usda.gov)
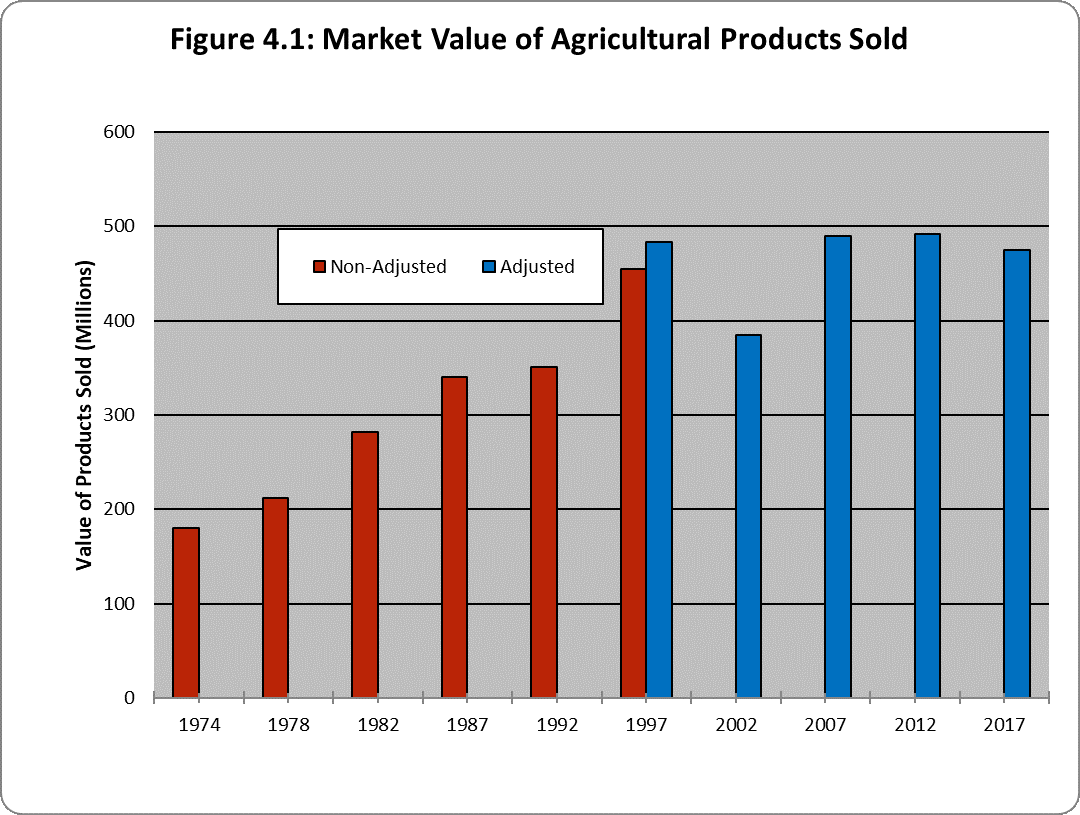
The market values in Figure 4.1 are not adjusted for inflation – they are what we call “nominal values.” Figure 4.2 shows the trends for both the nominal market value of agricultural products sold and the real value of agricultural products sold. To control for pure inflation, the nominal market value was deflated using the GDP deflator index for the U.S.; the real values are in terms of 2012 dollars. In real terms, the value of agricultural products sold in the state decreased from 1974 to 1982. There was then a slight increase in 1987 followed by a sharp decline in 1992 despite a modest increase in the nominal value. Thus, pure price inflation accounted for much or the nominal increase between 1987 and 1992, while the real market value fell. The nominal market value of agricultural products increased between 1992 and 1997 by $133 million. In real terms, the increase was a substantial $124 million. Between 1997 and 2002, the real market value declined by about $130 million (2012 dollars) compared to nominal decrease of nearly $100 million. The real value of agricultural products increased slightly between 2002 and 2007, but has declined in real value since 2017.