Sales in Counties
Massachusetts Agricultural Census 2017
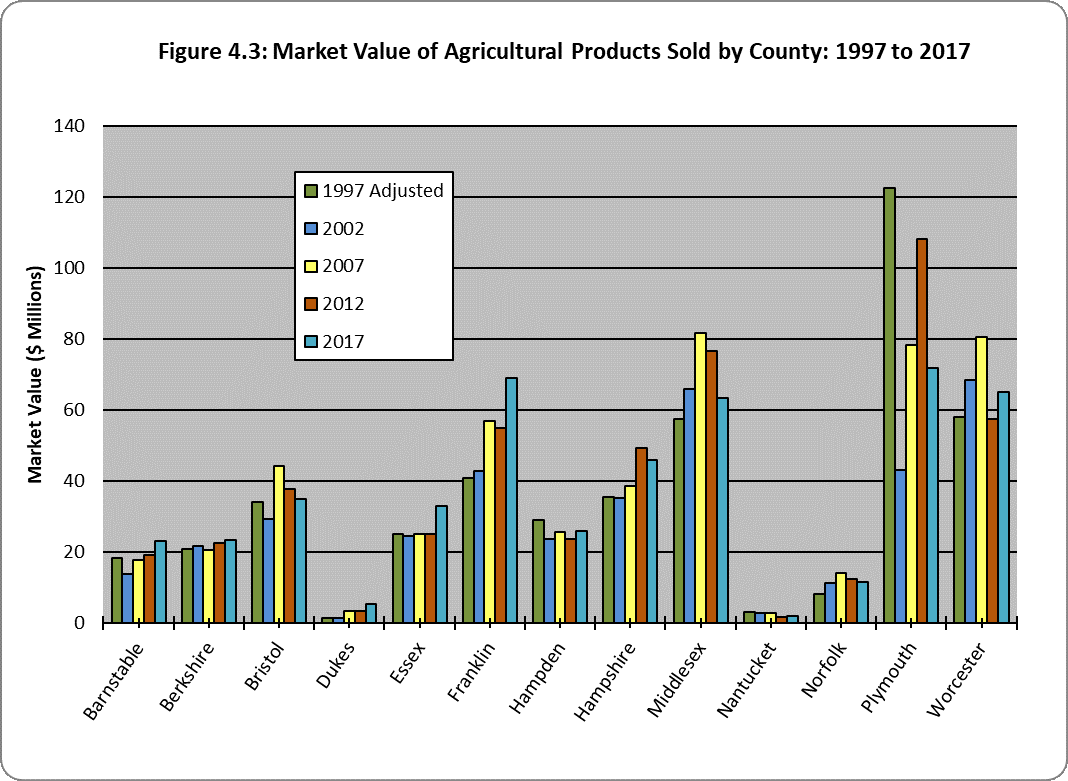
While the market value of agricultural products decreased for the Commonwealth as a whole between 2012 and 2017, some Massachusetts counties observed gains in the value of agricultural products sold (Figure 4.2 and Table 4.1). The greatest increases in the value of agricultural products sold were in Dukes County, which experienced a gain of 54.4 percent, and in Essex County, which experienced a gain of 30.6 percent in the value of agricultural products. Franklin County ranked third with a 25.1 percent increase in the market value of its agricultural products sold. The other counties that witnessed notable increases in the market value of agricultural products were: Barnstable County (20.9 percent); Bristol County (4.6 percent); Hampden County (9.7); Worcester County (13.4 percent), and Nantucket County (17.8 perent). Plymouth County saw the greatest decline, as the value of agricultural products dropped 33.4 percent. Bristol (7 percent), Hampshire (6.5 percent), Middlesex (17.2 percent) and Norfolk (7.7 percent) counties also experienced declines in the value of agricultural products sold.
As represented in Tables 4.1, 4.2 and 4.3, in 2017 Plymouth County accounted for most of the Commonwealth's agricultural production in terms of market value, 15.2 percent. Franklin County increased its share of market value, ranking second with 14.5 percent of agricultural production. Middlesex and Worcester counties captured 13.3 percent and 13.7 percent, respectively.
| County | 1997 Adjusted | 2002 | 2007 | 2012 | 2017 |
|---|---|---|---|---|---|
| Barnstable | 18.2 | 13.8 | 17.7 | 19.1 | 23.1 |
| Berkshire | 20.7 | 21.7 | 20.6 | 22.5 | 23.5 |
| Bristol | 34.1 | 29.4 | 44.2 | 37.7 | 35.0 |
| Dukes | 1.3 | 1.5 | 3.3 | 3.5 | 5.4 |
| Essex | 25.1 | 24.5 | 25.0 | 25.2 | 32.9 |
| Franklin | 40.7 | 42.9 | 56.8 | 55.1 | 68.9 |
| Hampden | 29.1 | 23.7 | 25.7 | 23.6 | 25.9 |
| Hampshire | 35.5 | 35.1 | 38.6 | 49.2 | 46.0 |
| Middlesex | 57.6 | 65.9 | 81.7 | 76.6 | 63.4 |
| Nantucket | 3.0 | 2.7 | 2.9 | 1.7 | 2.0 |
| Norfolk | 8.3 | 11.3 | 14.0 | 12.5 | 11.5 |
| Plymouth | 122.7 | 43.0 | 78.4 | 108.1 | 71.9 |
| Worcester | 57.9 | 68.6 | 80.6 | 57.5 | 65.2 |
| Massachusetts | 454.1 | 384.0 | 489.6 | 492.1 | 474.7 |
| County | 2002 to 2007 | 2007 to 2012 | 2002 to 2012 | 2012 to 2017 |
|---|---|---|---|---|
| Barnstable | 27.7% | 8.4% | -24.1% | 20.9% |
| Berkshire | -5.2% | 9.1% | 4.8% | 4.6% |
| Bristol | 50.7% | -14.9% | -13.9% | -7.0% |
| Dukes | 129.5% | 4.6% | 16.3% | 54.4% |
| Essex | 2.3% | 0.6% | -2.5% | 30.6% |
| Franklin | 32.3% | -3.1% | 5.4% | 25.1% |
| Hampden | 8.7% | -8.3% | -18.6% | 9.7% |
| Hampshire | 10.1% | 27.5% | -1.2% | -6.5% |
| Middlesex | 24.0% | -6.3% | 14.5% | -17.2% |
| Nantucket | 7.8% | -42.6% | -9.3% | 17.8% |
| Norfolk | 23.6% | -10.6% | 36.8% | -7.7% |
| Plymouth | 82.5% | 37.8% | -65.0% | -33.4% |
| Worcester | 17.5% | -28.6% | 18.3% | 13.4% |
| Massachusetts | 27.5% | 0.5% | -15.5% | -3.5% |
| County | 2002 | 2007 | 2012 | 2017 |
|---|---|---|---|---|
| Barnstable | 3.6% | 3.6% | 3.9% | 4.9% |
| Berkshire | 5.7% | 4.2% | 4.6% | 4.9% |
| Bristol | 7.6% | 9.0% | 7.7% | 7.4% |
| Dukes | 0.4% | 0.7% | 0.7% | 1.1% |
| Essex | 6.4% | 5.1% | 5.1% | 6.9% |
| Franklin | 11.2% | 11.6% | 11.2% | 14.5% |
| Hampden | 6.2% | 5.3% | 4.8% | 5.5% |
| Hampshire | 9.1% | 7.9% | 10.0% | 9.7% |
| Middlesex | 17.2% | 16.7% | 15.6% | 13.3% |
| Nantucket | 0.7% | 0.6% | 0.3% | 0.4% |
| Norfolk | 2.9% | 2.9% | 2.5% | 2.4% |
| Plymouth | 11.2% | 16.0% | 22.0% | 15.2% |
| Worcester | 17.9% | 16.5% | 11.7% | 13.7% |
| Massachusetts | 100.0% | 100.0% | 100.0% | 100.0% |
