Acres – Cropland
Massachusetts Agricultural Census 2017
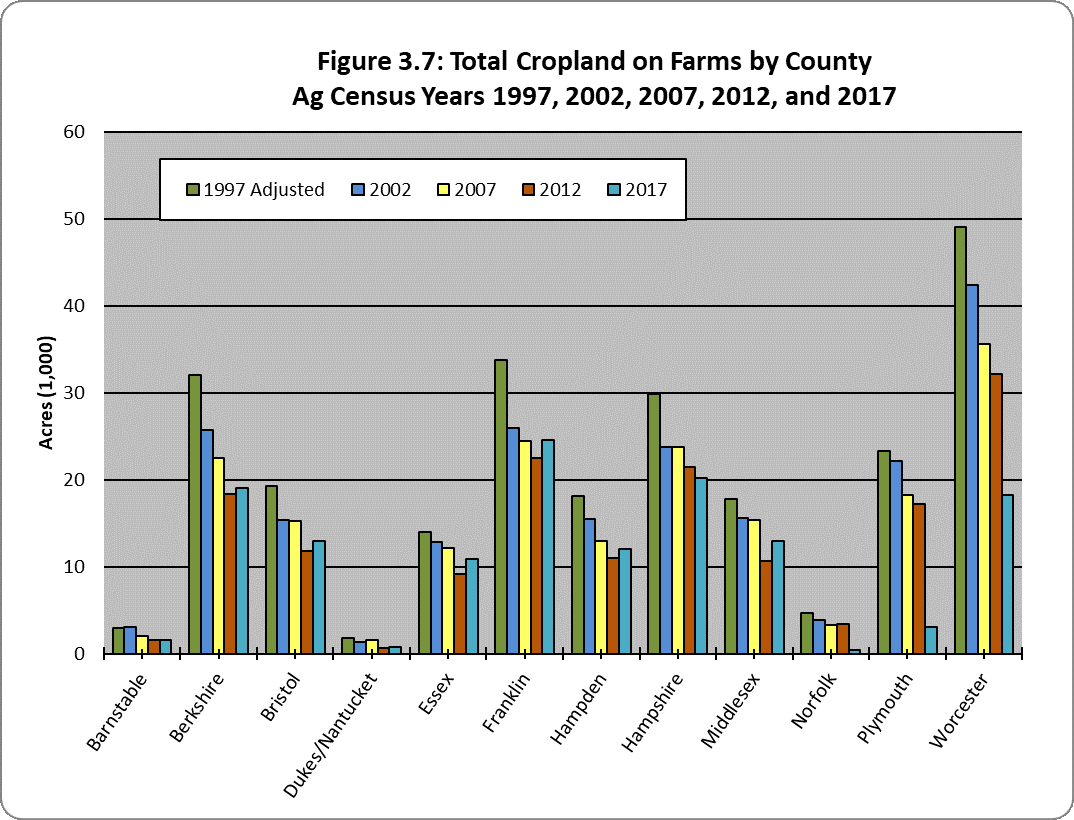
Cropland is one subset of total agricultural land, the most productive subset of our agricultural land. Total cropland acreage decreased in Massachusetts by 30 percent between 1997 and 2017. Cropland declined by 10 percent between 2002 and 2007, and by 14 percent between 2007 and 2012, and increased almost 7 percent between 2012 and 2017. Most Massachusetts counties except Hampshire, Nantucket and Norfolk saw a rebound in total cropland acres between 2012 and 2017 (Figure 3.7). The gains ranged from 3.7 percent in Berkshire County, to an 21.5 percent increase in cropland acres in Middlesex County. Hampshire County saw a 5.9 percent decrese in total cropland, Nantucket County saw a significant 25.6 percent decrease in total cropland, and Norfolk County a 10.3 percent increase in total cropland.

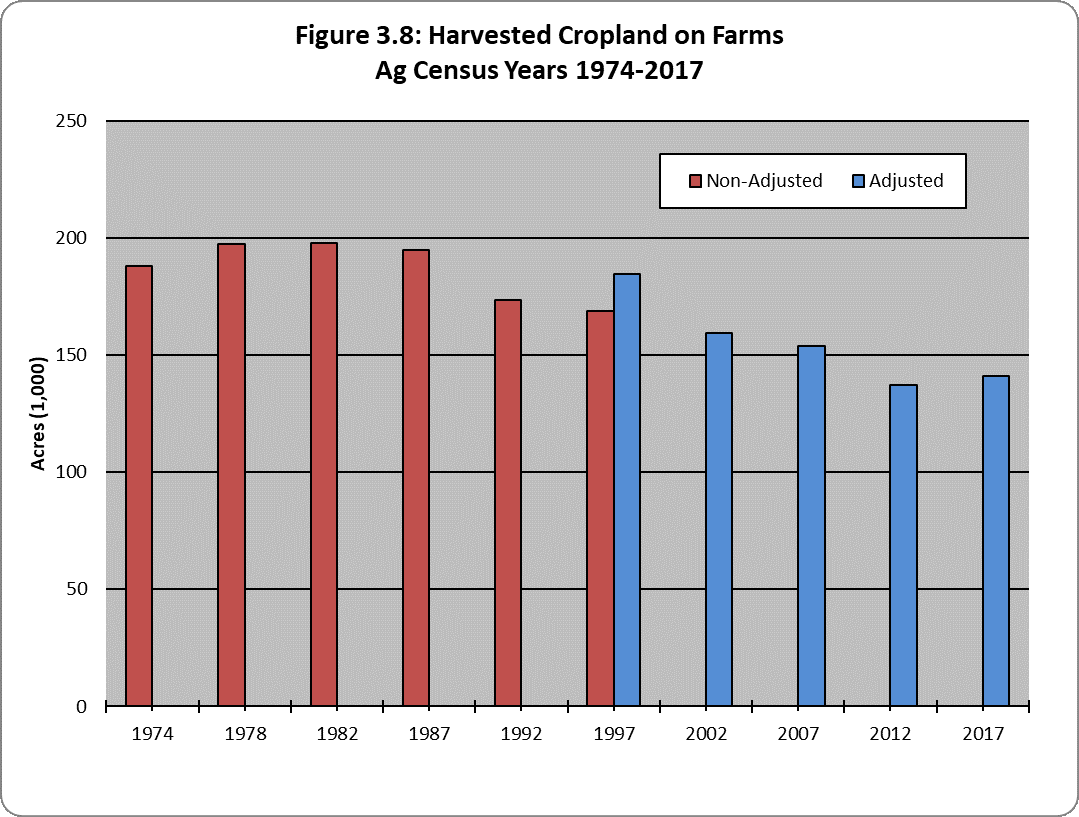
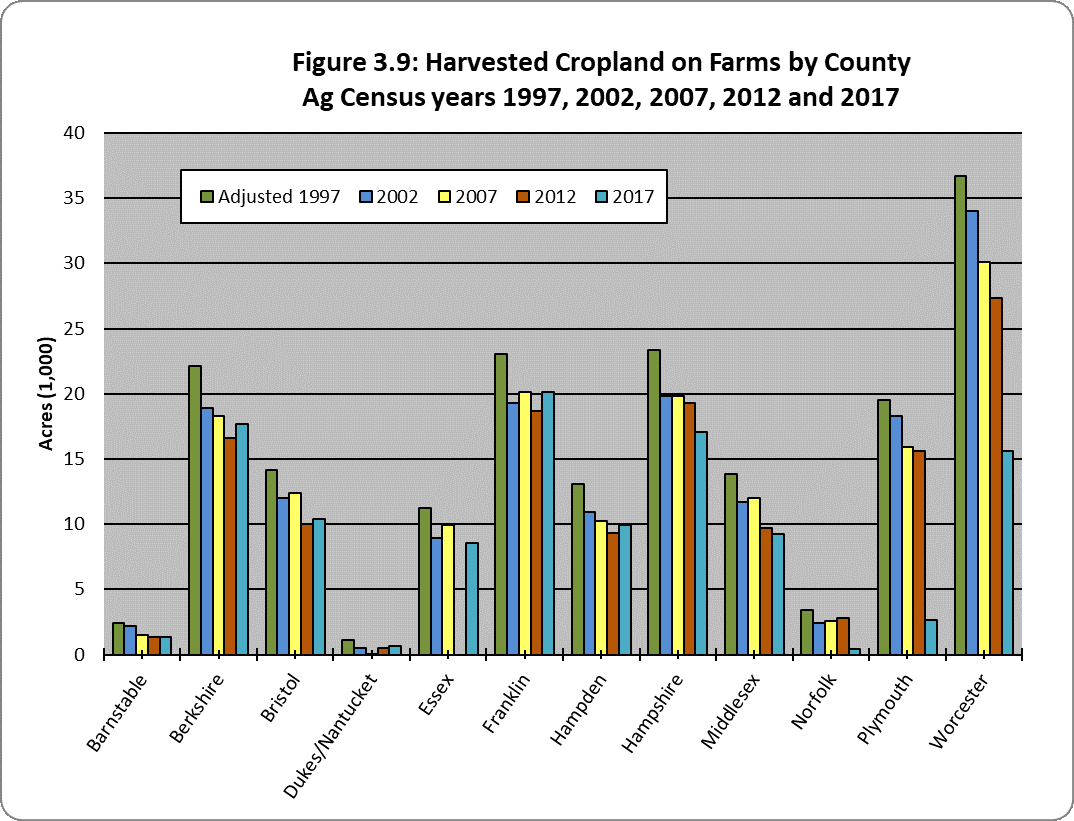
Harvested cropland similarly decreased every census year since 1997 until a slight uptick in 2017 (Figure 3.8). Harvested cropland acreage decreased by 23.6 percent between 1997 and 2017, with 3.3 percent between 2002 and 2007, and 11 percent between 2007 and 2012, and 2.8 percent between 2012 and 2017. Five counties increased harvested cropland between 2012 and 2017, ranging from 0.4 percent in Worcester County to 7.6 percent increase in Franklin County (the 119.6 percent in Dukes/ Nantucket Counties is partially attributable to missing observations in 2012) (Figure 3.9). Decreases in harvested cropland between 2012 and 2017 range from 0.08 percent in Plymouth County to 11.6 percent in Hampshire County. Reductions in harvested cropland acres can be attributed to increased population expansion pressures, including development and suburban sprawl, which has been observed throughout the state. As more and more people migrate to coastal counties, harvested cropland acres will likely to diminish. Depressed commodity prices, increased costs of production and the aging farm population all play roles.