Acres – Irrigated Land
Massachusetts Agricultural Census 2017
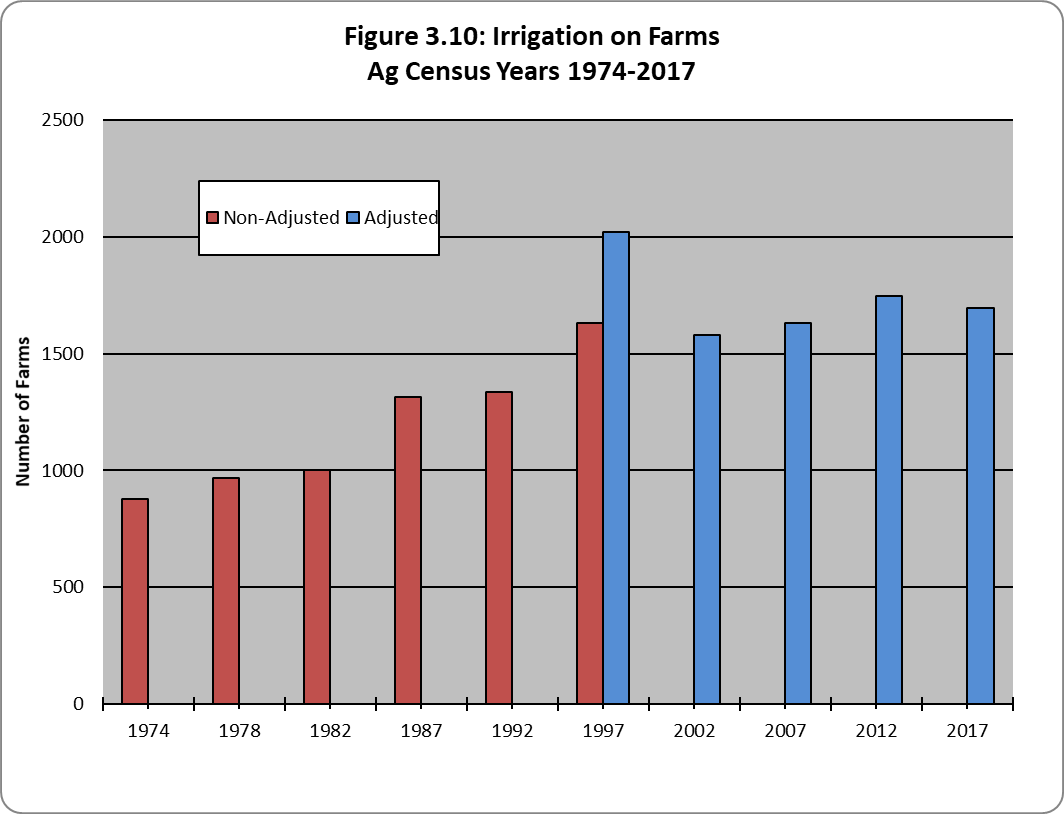
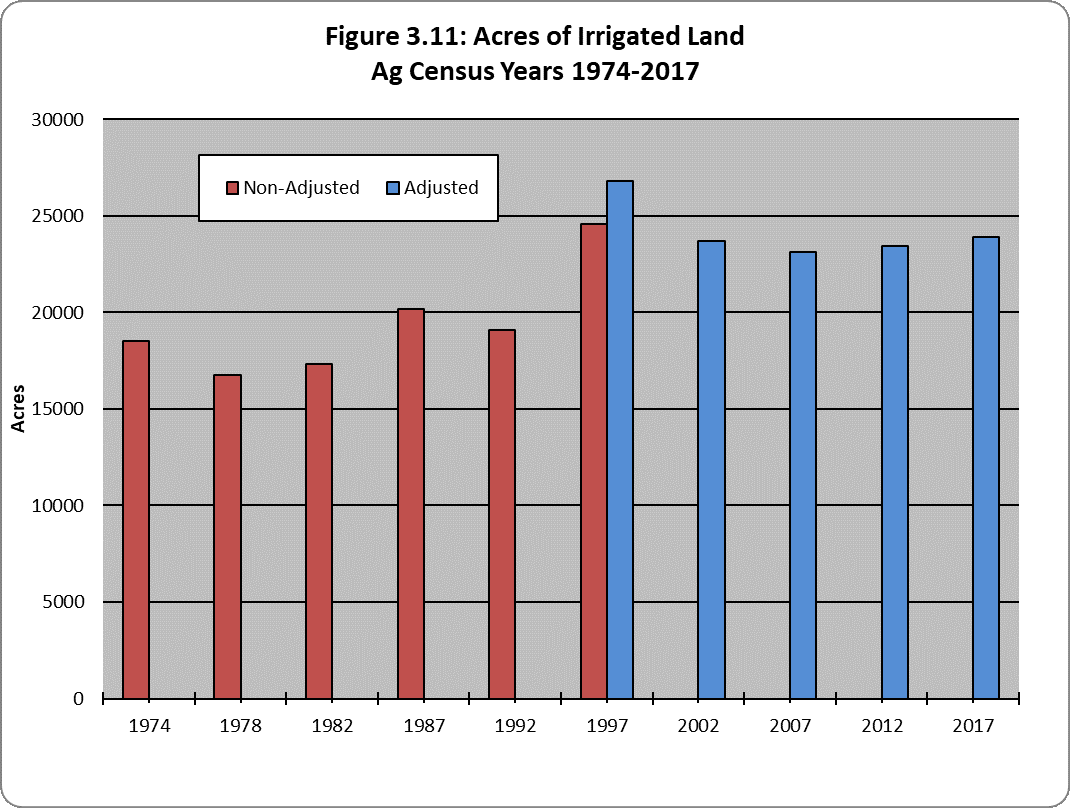
Massachusetts had a 2.9 percent decrease in the number of farms that use irrigation between the years 2012 to 2017, although the number of farms that use irrigation has increased a total of 92.9 percent between 1974 and 2017 (Figure 3.10). Irrigation is becoming an increasingly important activity on farms in Massachusetts. The total number of acres that were irrigated rose between 2012 and 2017 by 2.1 percent (Figure 3.11). Considering past years, it is difficult to assess whether the long-run trend in irrigated acreage is increasing or decreasing. While the previous three census years registered increased in farms that use irrigation, the 2017 census years show a decrease. On the other hand, 2012 and 2017 saw slight increases in acreage irrigated, despite a decreasing trend the previous two census years. As nursery and greenhouse crops increase in importance, we would expect an increase in the amount of irrigation.
From Figure 3.12, Plymouth County uses the most irrigation in farming activities by far compared to all the other counties. The amount of irrigated land fell 0.9 percent between 2012 and 2017, from 11,994 acres to 11,888. Plymouth County has used the most irrigation because of the many cranberry bogs that account for much of that county's agricultural sales. The largest gains in irrigated acres were observed in Essex County, which saw a 112.4 percent increase from 2012 to 2017. Middlesex County's irrigated land was observed to have decreased by 28 percent, the largest decrease between 2012 and 2017. Large decreases can also be seen in Franklin and Norfolk Counties, whose irrigated land dropped by 13.4 percent and 11.7 percent respectively. Other counties' increases in irrigated land can be seen in Dukes (25.9 percent), Berkshire (21.2 percent) and Barnstable (21.1 percent) Counties, although the large percentage increases do not translate into large increases in the absolute number of irrigated acres. Dukes and Berkshire increase the number of irrigated acres from 205 to 258 and 1,612 to 1,953 acres, respectively, numbers that are dwarfed by those of Plymouth County.
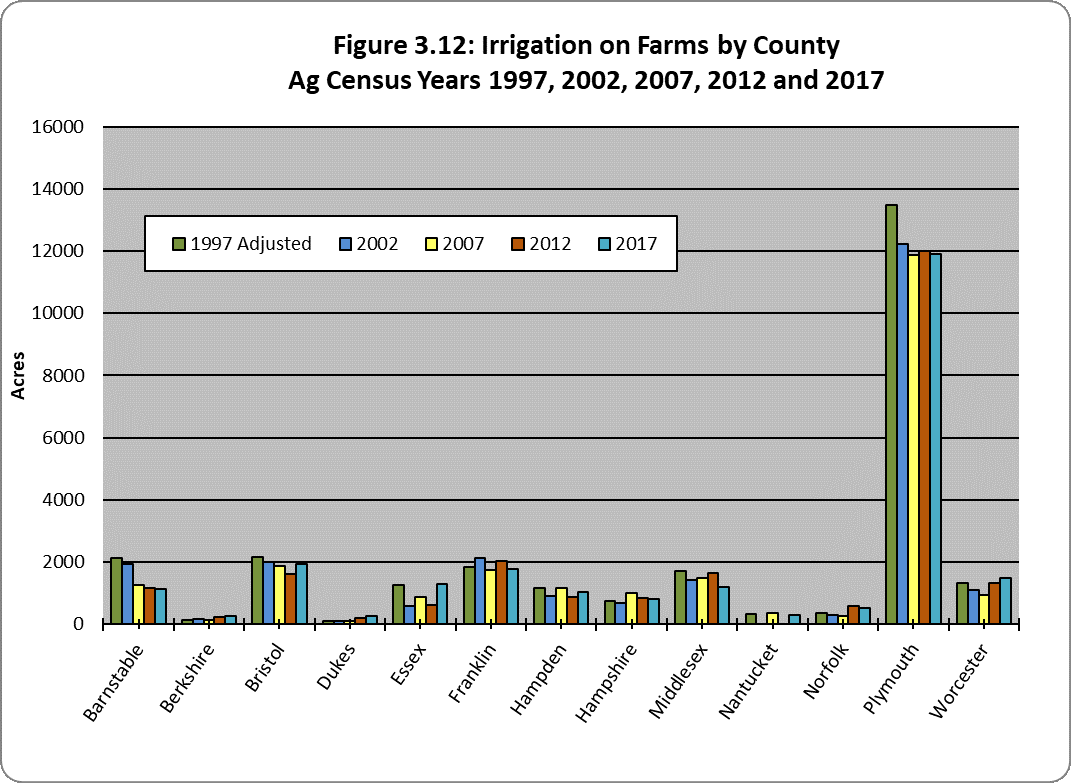
Table 3.1 shows the increases that occurred in the number of farms using irrigation and the number of acres irrigated. The two columns for farms and the two columns for acres reflect the changes that occurred in 1997 in counting farms. There are not clear trends; it appears that the number of farms using irrigation was rising until 2017, while the number of acres irrigated was declining, but these trends did not bear out in the 2017 Census.
| Year | Farms | FARMS | ACRES | ACRES |
|---|---|---|---|---|
| 1974 | 879 | 18,512 | ||
| 1978 | 966 | 16,753 | ||
| 1982 | 1,000 | 17,331 | ||
| 1987 | 1,316 | 20,158 | ||
| 1992 | 1,336 | 19,090 | ||
| 1997 | 1,630 | 2,021 | 24,564 | 26,820 |
| 2002 | 1,580 | 23,720 | ||
| 2007 | 1,630 | 23,133 | ||
| 2012 | 1,746 | 23,433 | ||
| 2017 | 1,696 | 23,928 | ||
| % CHANGE 74 - 12 | 98.63% | 26.58% | ||
| % CHANGE 97 - 12 | 15.75% | 14.45% | ||
| % CHANGE 07 - 12 | 7.12% | 1.30% | ||
| % CHANGE 12 - 17 |
-2.86% |
2.11% |
